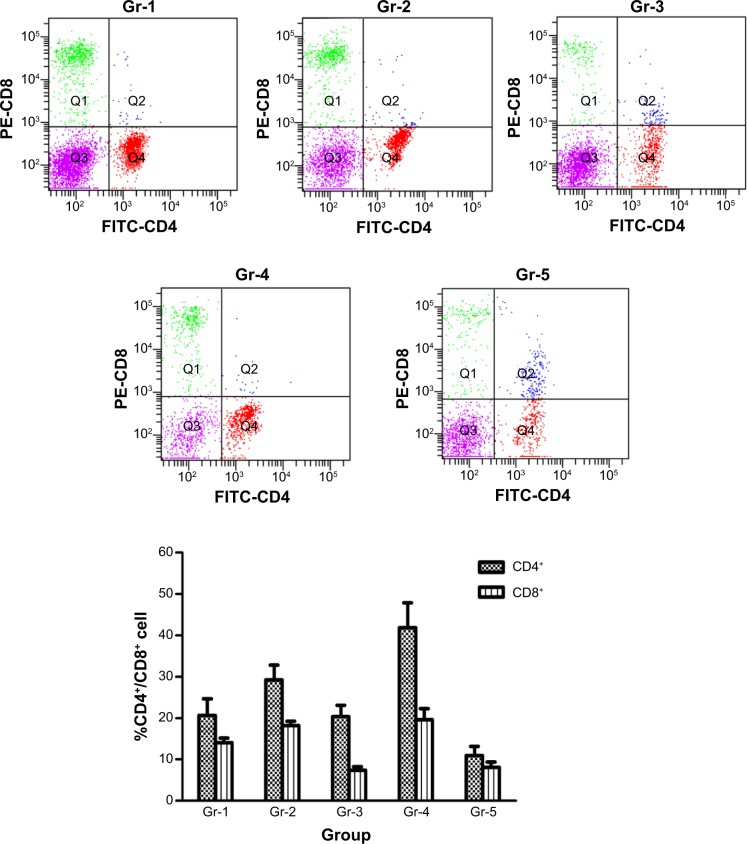
Figure 6.
Flow cytometry for percentages of lymphocyte subpopulations between experimental and control groups.
Notes: Heparinized blood from immunized cattle on 10 dpv were double-stained with anti-CD4-FITC and anti-CD8-PE, or incubated with the corresponding isotype controls (anti-CD8-PE and anti-IgG2a-PE, or anti-CD4-FITC and anti-IgG2a-FITC) for 30 minutes at room temperature. CD4+ and CD8+ T cells were analyzed as fluorescence profiles. Data are expressed as mean ± SD (n=5).
Abbreviations: dpv, days postvaccination; Ig, immunoglobulin; FITC, Fluorescein isothiocyanate; Gr, group; PE, phycoerythrin; SD, standard deviations.

