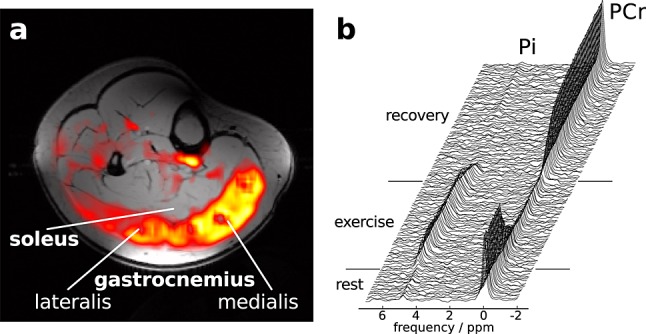
Figure 1.

(a) EPI slice of human calf, showing the difference of SEPI during the post exercise peak and the pre exercise intensity, overlaid on an axial gradient-echo image. Zero or negative values are transparent. (b) Time series of unaveraged single-shot 31P spectra (every 6 s) localised to gastrocnemius medialis.
