Figure 2.

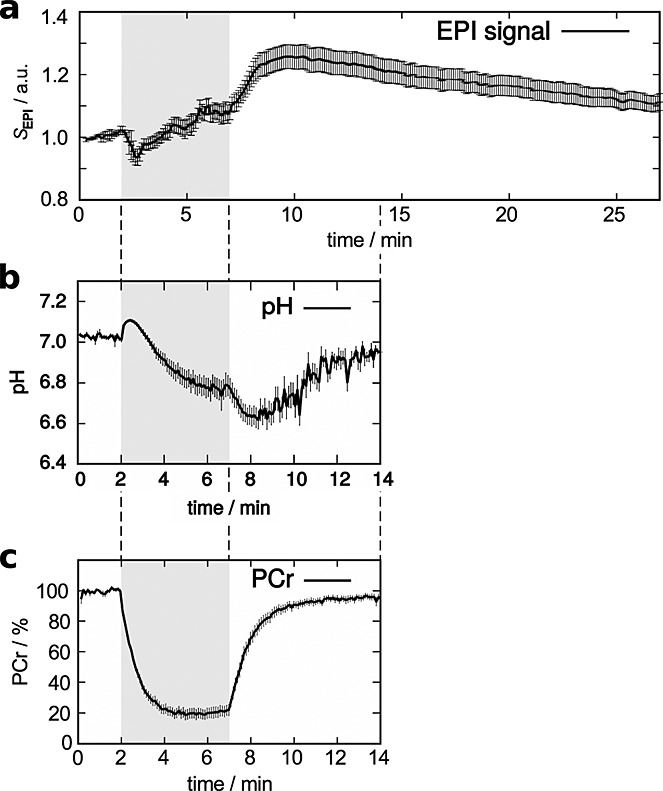
Mean ± standard error of the mean of (a) SEPI, (b) pH and (c) PCr signal time course. Data from the two subjects with very slow PCr recovery and long TTP SEPI were excluded from plots (b and c).

Mean ± standard error of the mean of (a) SEPI, (b) pH and (c) PCr signal time course. Data from the two subjects with very slow PCr recovery and long TTP SEPI were excluded from plots (b and c).