
Figure 4.
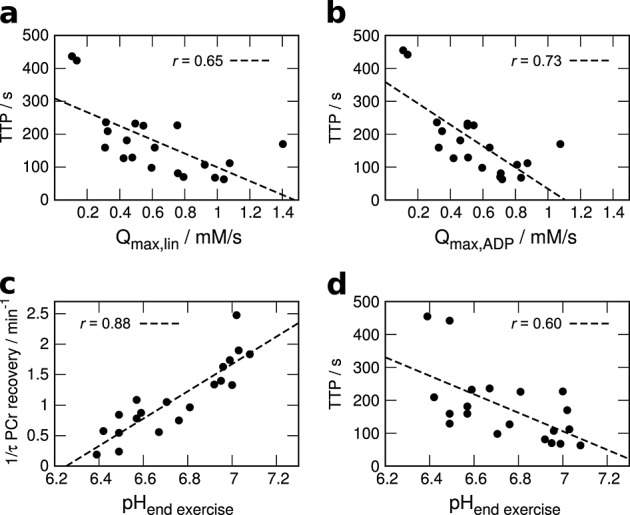
Correlation of TTP SEPI and (a) linear and (b) ADP-driven models of maximum oxidative phosphorylation, along with end exercise pH correlated with both (c) PCr recovery rate 1/τ and (d) TTP SEPI.
Official websites use .gov
A
.gov website belongs to an official
government organization in the United States.
Secure .gov websites use HTTPS
A lock (
) or https:// means you've safely
connected to the .gov website. Share sensitive
information only on official, secure websites.
Correlation of TTP SEPI and (a) linear and (b) ADP-driven models of maximum oxidative phosphorylation, along with end exercise pH correlated with both (c) PCr recovery rate 1/τ and (d) TTP SEPI.