
Fig 6.
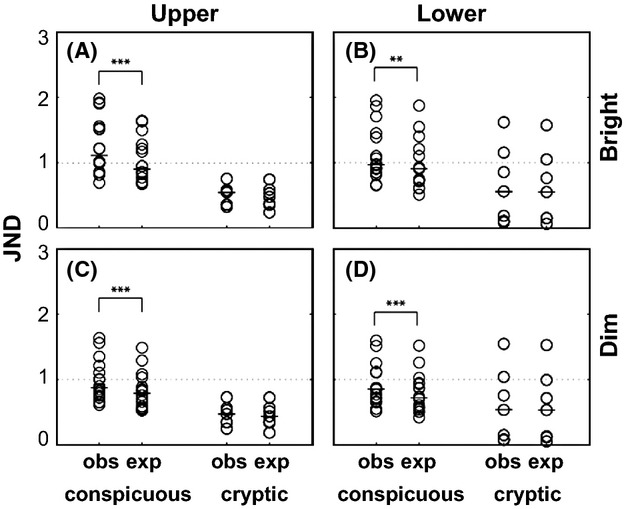
Comparison of just noticeable difference (JND) distribution between two trichromat models with the observed and the expected λmax sets of the L/M opsin alleles for conspicuous and cryptic fruits against upper leaves (A) and lower leaves (B) under bright light condition and against upper leaves (C) and lower leaves (D) under dim light condition. Each species was plotted as an open circle. Bars indicate medians. Dashed lines indicate 1 JND. Asterisks indicate significant levels, ***: P < 0.0001, **: P < 0.01, by 2-tailed Wilcoxon signed-rank test.