
Fig 2.
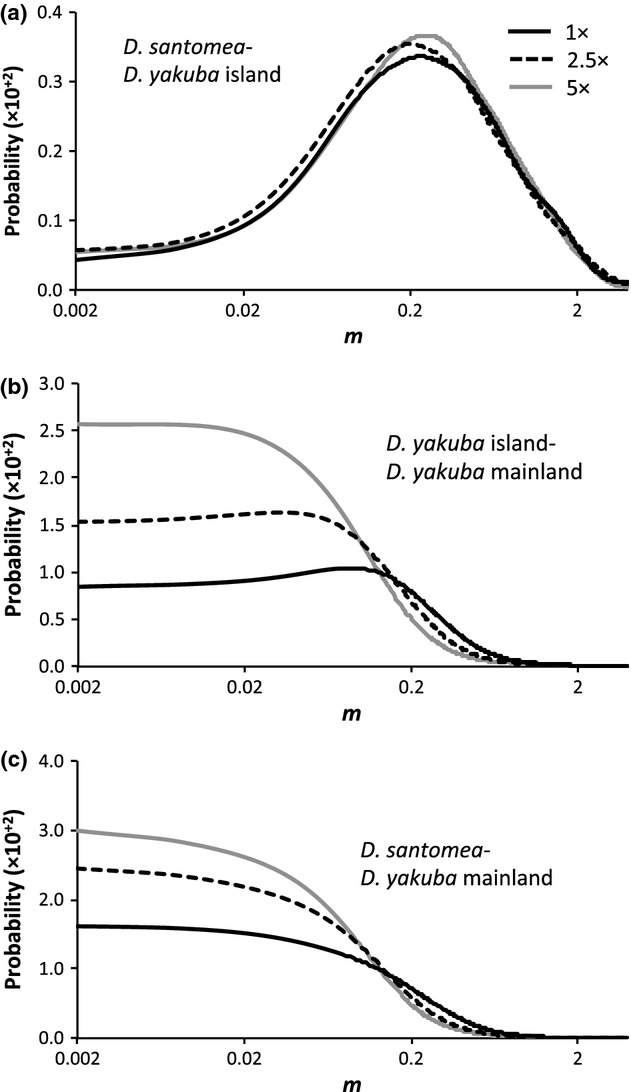
Marginal density for the migration rate parameter (m) obtained by fitting the isolation-with-migration model to a data set with three descendant populations. Marginal density for m between (a) Drosophila santomea–Drosophila yakuba island populations, (b) D. yakuba island–D. yakuba mainland populations and (c) D. santomea –D. yakuba mainland populations. 1, 2.5 and 5× correspond to θ per sequence of ∼30, ∼75 and ∼150, respectively (θ per sequence observed in the D. yakuba mainland, D. yakuba island and D. santomea populations are 23.27, 18.68 and 21, respectively).