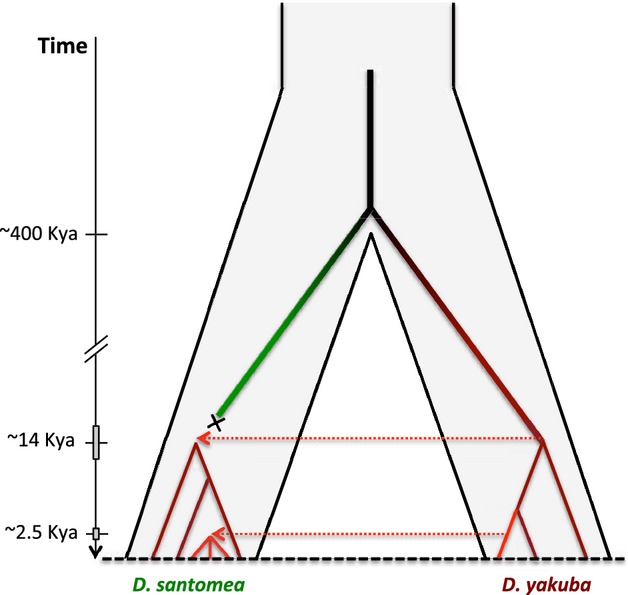
Fig 5.

Schematic representation of the temporal dynamics of mitochondrial introgression in the Drosophila yakuba–Drosophila santomea system. Grey rectangles represent upper and lower 95% highest posterior density of the time to the most recent common ancestor.
