
Figure 2.
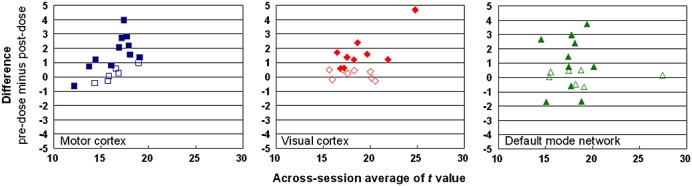
Intersession comparison of functional connectivity by statistical significance (t values) for each subject. Left to right: motor cortex (blue squares), visual cortex (red diamonds) and the default mode network (green triangles). Each subplot has 17 data points that represent the 17 subjects included in this study. For each subject and for each of the three anatomical areas investigated, the t value difference between sessions was inspected within the voxels revealed to be connected both before and after caffeine ingestion using the paired Student's t-test (significance level = 0.05 after Bonferroni correction for multiple comparisons). The subjects in whom a significant difference was not found are denoted with open symbols.