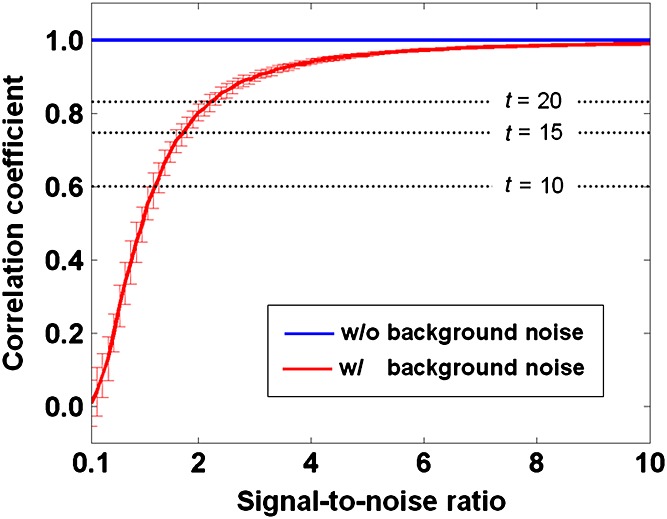
Figure 7.

Simulated effect of the signal-to-noise ratio (SNR) on the calculation of the functional connectivity. Resting-state fluctuation was presumed to be Gaussian and 1% in amplitude, whereas caffeine was assumed to double the fluctuation. Background noise was assumed to be Gaussian, with the SNR varied from 0.1 to 10 in steps of 0.1. One hundred random samples were generated for each degree of SNR. The thick red curve and error bars indicate the mean and standard deviation, respectively, of the computed correlation coefficients in the presence of noise. The thick blue line shows the mean correlation coefficient computed without noise (standard deviation is too small to be included in the plot). The dotted lines indicate the t values corresponding to the correlation coefficients after correction for family-wise errors. The t values are shown in reference to Fig. 2.
