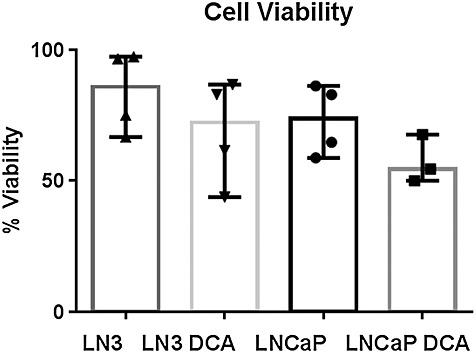
Figure 3.

Plot showing the median and range of viability of cells by cell type and treatment prior to entry into the bioreactor. Each point represents an individual experiment. The untreated LNCaP-LN3 and LNCaP cells showed similar maximum viability values. A Kruskal–Wallis test showed that there was no significant difference in viability between the four treatment groups (p > 0.5).
