Figure 5.

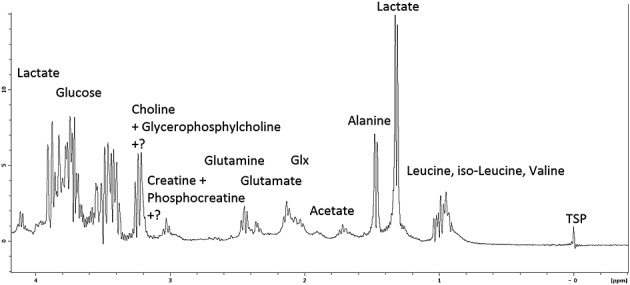
Example of representative high-resolution 1H spectrum from LNCaP-LN3 cells following 24 h of treatment with 50mM dichloroacetate (DCA) with nominal assignment labels. Some regions contain unidentified peaks. TSP, trimethylsilyl propionate.

Example of representative high-resolution 1H spectrum from LNCaP-LN3 cells following 24 h of treatment with 50mM dichloroacetate (DCA) with nominal assignment labels. Some regions contain unidentified peaks. TSP, trimethylsilyl propionate.