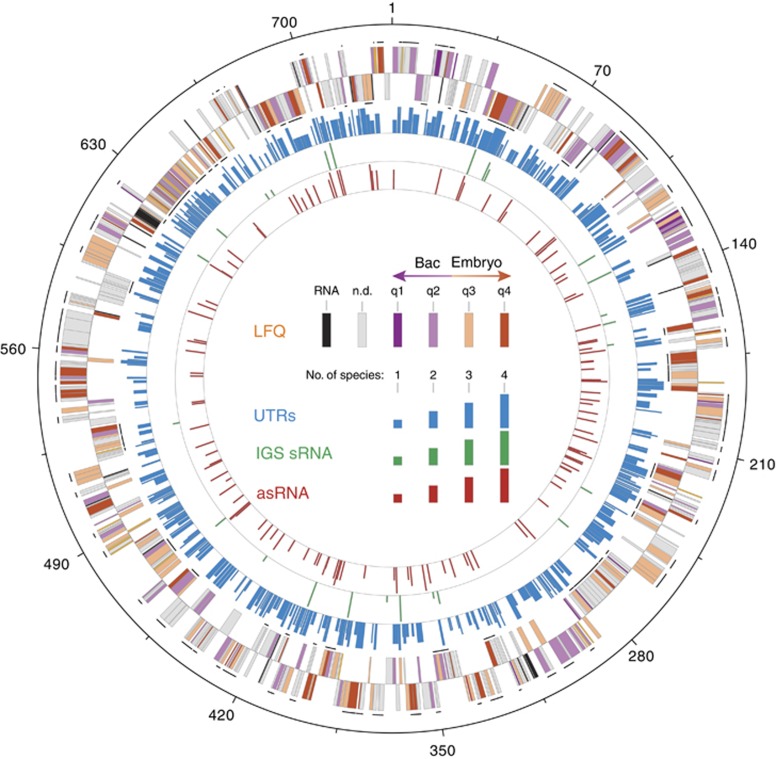
Figure 5.
Genome-wide map of protein and small RNA (sRNA) expression in Buchnera. Protein expression profiles and identified sRNAs are mapped onto the global alignment of the five Buchnera strain genomes. The outermost circles indicate genes on the 5′ and 3′ strands of the genome starting from the origin of replication (nt 1). Genes are colored according to the key as canonical RNAs (black), not detected in the LFQ analysis (gray), or differentially expressed as proteins (dark purple = upregulated in the Bacteriocytes (Bac) to dark orange = upregulated in the Embryos). Predicted transcriptional units with more than one protein are shown as solid black lines. The next circle shows genes that were found to have a 5′ and/or 3′ UTR (blue) and the following two circles denote the locations of the conserved intergenic sRNAs (green) and asRNA (red), respectively. Bar heights correspond to the number of genomes the element was conserved in. For simplicity, Buchnera-LSR1 and Buchnera-5A are represented as the consensus ‘Buchnera-Ap'.

