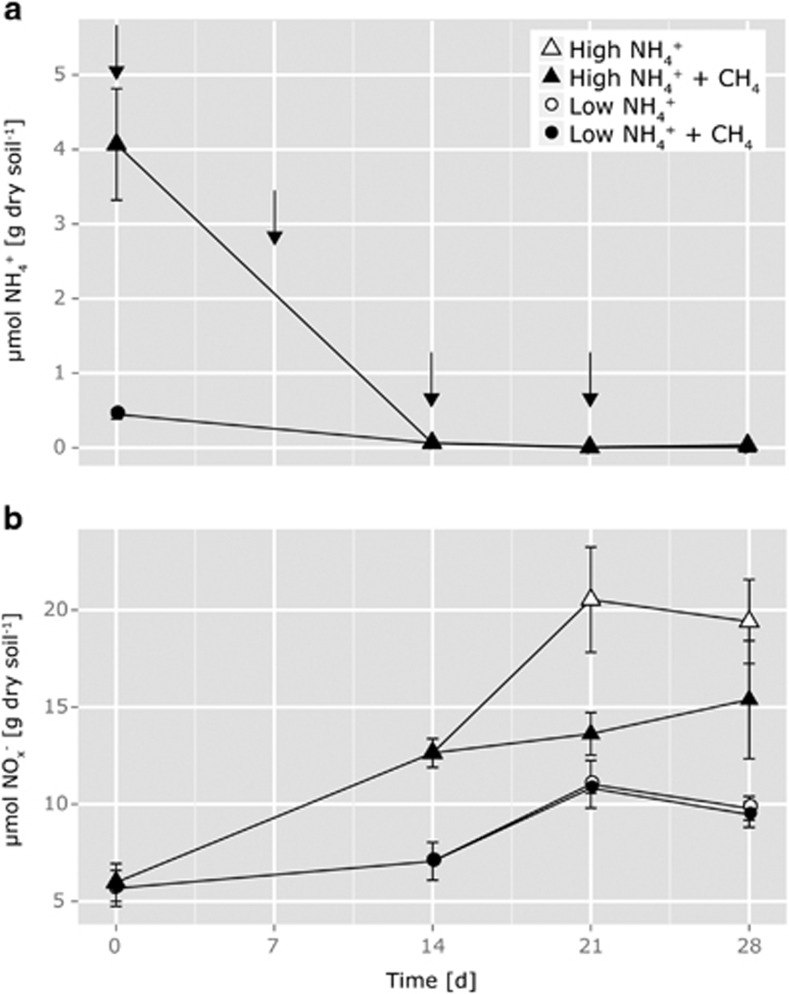
Figure 1.
Changes in ammonium (a) and nitrite plus nitrate (b) concentrations in soil microcosms incubated at 25 °C for 0, 14, 21 or 28 days at low (15 μg NH4+-N per g dry soil added initially; 7.5 μg NH4+-N per g dry soil on days 7, 14 and 21) and high (150 μg NH4+-N per g dry soil added initially; 75 μg NH4+-N per g dry soil on days 7, 14 and 21) levels of ammonium and concentrations of 0% and 1% methane in the headspace. Arrows in (a) indicate ammonium addition. Data plotted are mean values and s.e. from 3 to 6 replicate microcosms destructively sampled at each time point, with some symbols nonvisible because they are masked by others.

