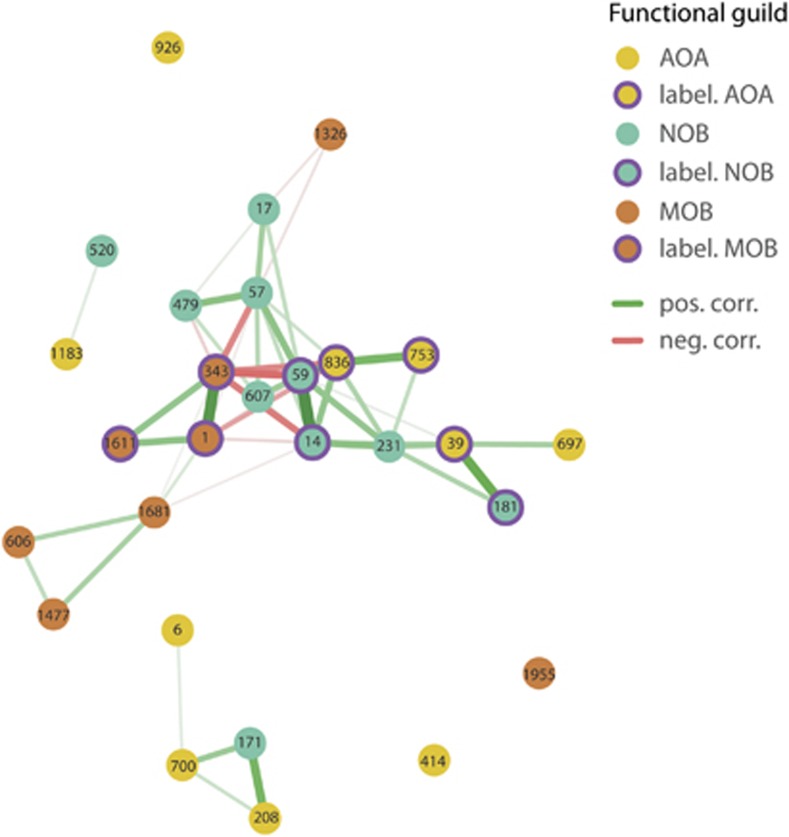
Figure 7.
Network analysis of co-occurring phylotypes of AOA, NOB and MOB in microcosms incubated at low (15 μg NH4+-N per g dry soil added initially; 7.5 μg NH4+-N per g dry soil on days 7, 14 and 21) and high (150 μg NH4+-N per g dry soil added initially; 75 μg NH4+-N per g dry soil on days 7, 14 and 21) levels of ammonium for 14 and 28 days as well as with and without 1% methane for the last 14 days of incubation. Nodes represent the 10 most abundant OTUs of each of the three functional guilds and connecting lines stand for strong (Spearman's ρ>0.6) and significant (p-value of <0.05) positive (green) or negative (red) correlations where a thicker and shorter line represents a stronger correlation. Purple circles around nodes mark phylotypes that had actively incorporated the 13C label.

