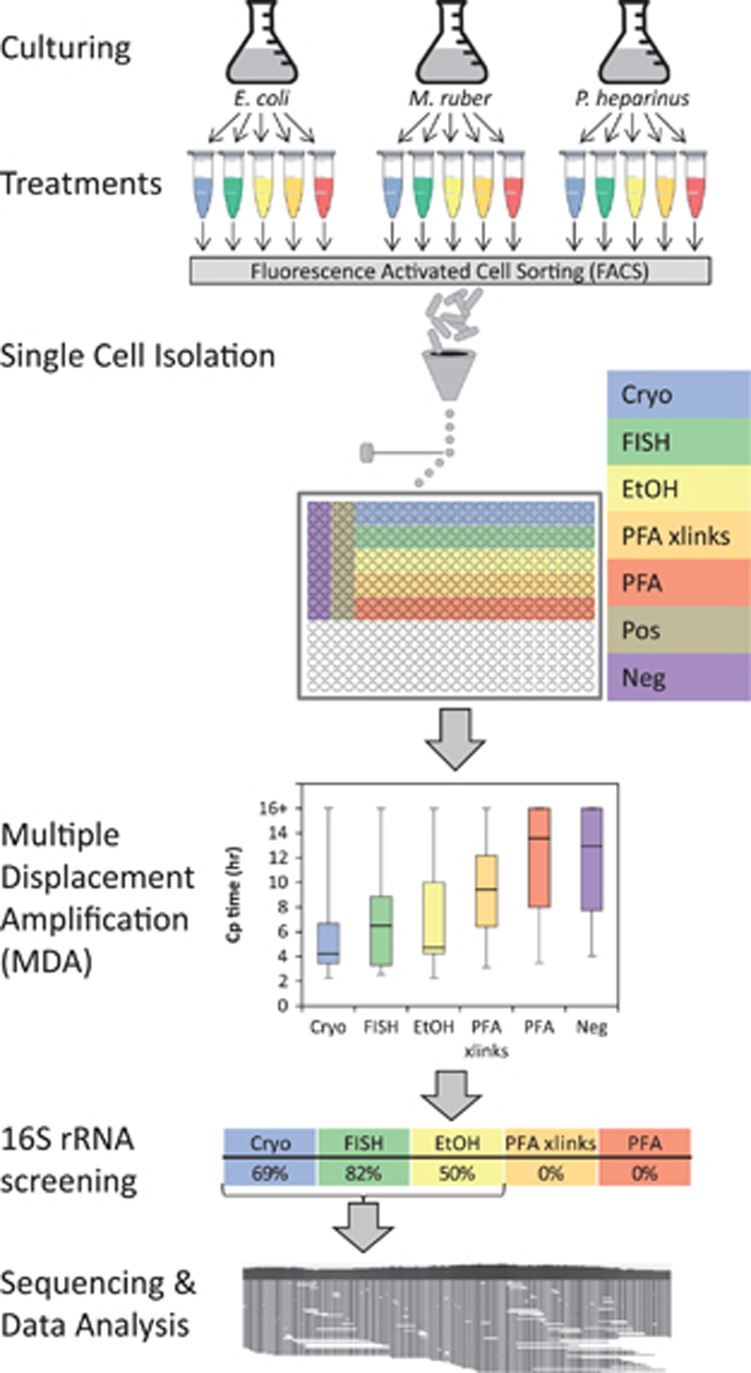
Figure 1.
Schematic of experimental workflow. For clarity the treatments are color coded throughout the figure and are: blue, Cryo—cryopreservation; green, FISH—FISH treatment; yellow, EtOH—ethanol fixation; orange, PFA xlinks—paraformaldehyde fixation with crosslinks reversed; red, PFA—paraformaldehyde fixation with crosslinks intact; brown, Pos—positive controls (wells each with 100 cryopreserved cells); purple, Neg—no cell-negative controls. The layout used for the single cell isolations in a 384-well plate is shown. Each strain/treatment combination was sorted separately onto one plate per strain. The MDA step in this figure plots the Cp (inflection point) values for the real-time MDA amplification curves for all three bacterial species combined. The MDA reaction is run for 16 h, so any wells that show no amplification by that time are indicated as 16+ on the graph. Each column in the chart summarizes data from 120 separate MDA reactions, except for the negative control, which involves 60 reactions. 16S rRNA gene screening indicates the percentage of the wells for each treatment that produced a 16S rRNA gene sequence from the reference organism.

