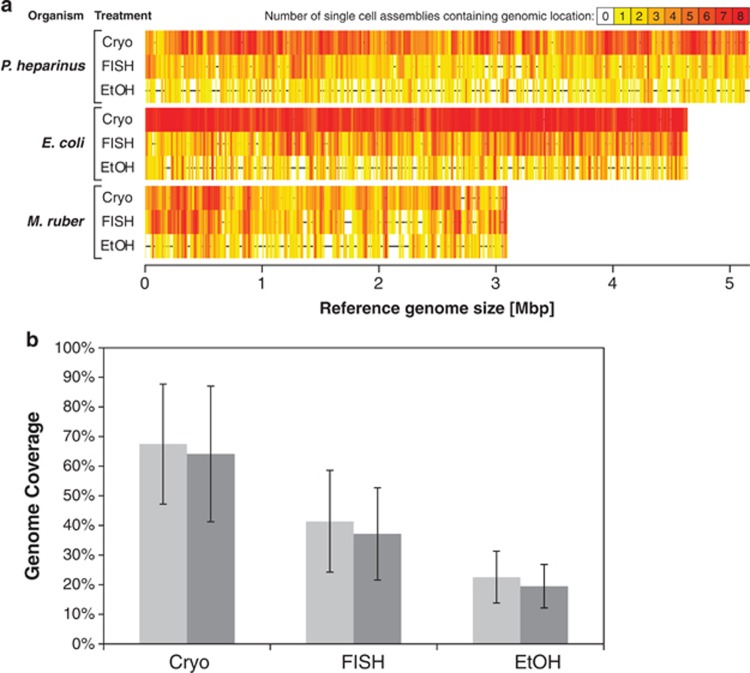
Figure 2.
(a) Coverage plots for each organism/treatment combination. Cryo—cryopreservation, EtOH—ethanol preservation, FISH—FISH treatment. The horizontal black lines in the center of each plot represent the complete reference genomes and the vertical colored lines indicate which parts of the genome were recovered in the assemblies. Redder colors indicate that more single cells contained that region in their assembly. (b) Percent of the genomes recovered for each treatment with the single cells from all three organisms averaged together and the error bars indicating one standard deviation. Light gray bars indicate the genome recovery by mapping the reads to the reference genomes. A base pair was considered to be recovered if at least 10 reads were mapped to cover it. Dark gray bars are the genome recovery by mapping contigs produced by de novo assembly to the reference genomes. The treatments are significantly different from each other (ANOVA; P<0.0001).

