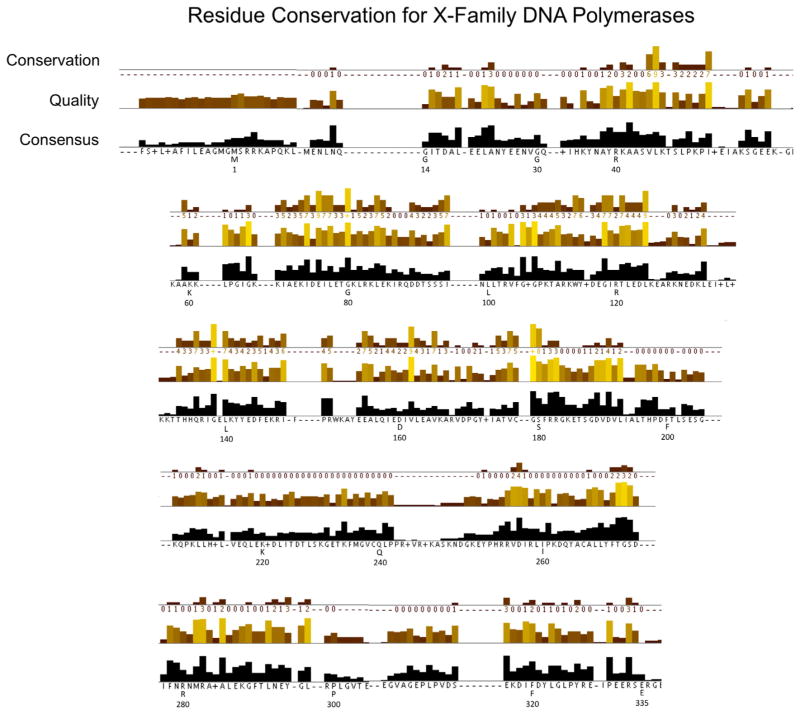
Fig. 2.
Amino acid sequence conservation and analysis corresponding to human pol β. The numbering under the sequence corresponds to that for human pol β, while the letter indicates the consensus sequence at that position. The JalView alignment quality displayed below the conservation columns is a measure of the likelihood of observing mutations at that position in the alignment [27]. Specifically, the quality score is calculated for each column in the alignment by summing, for all mutations, the ratio of the two BLOSUM 62 scores for a mutation pair and each residue’s conserved BLOSUM62 score (which is higher). This value is normalized for each column, and then plotted on a scale from 0 to 1. Conservation is measured as a numerical index reflecting the conservation of chemical properties in the alignment; identical residues score highest with the next most conserved group containing substitutions to amino acids within the same chemical class. Conservation is visualized on the alignment as a histogram giving the score for each column. Conserved columns are indicated by ‘*’ (score of 11 with default amino acid property grouping), and columns with mutations with conserved chemical properties are marked with a ‘+’ (score of 10, indicating all properties are conserved).

