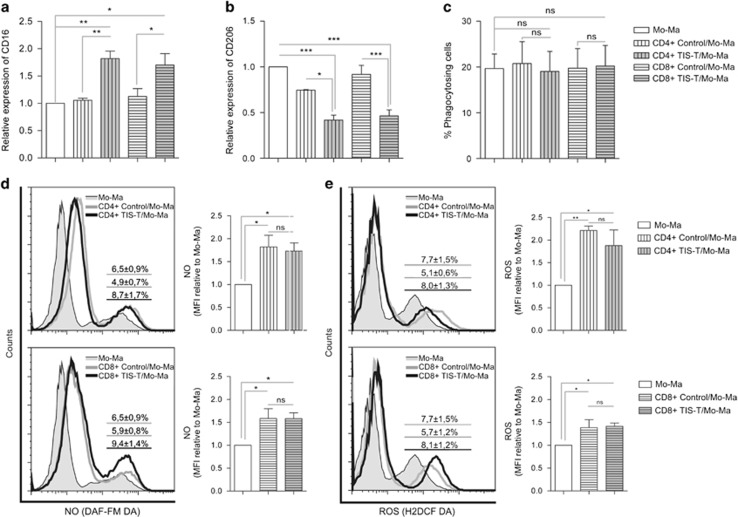
Figure 1.
CD4+ and CD8+ TIS-T cells induce classical activation in monocytes/macrophages. Monocytes were cultured alone, with CD4+ or CD8+ control T cells, or with CD4+ or CD8+ TIS-T cells (in 1:1 ratio), in the presence of anti-CD3 mAb (2 μg/ml). The phenotype of Mo/Ma and their ability to produce NO and ROS was assessed after 40 h of co-culture. (a) CD16 expression (average MFI±S.E.M.) on Mo/Ma co-cultured with TIS-T cells or control T cells relative to Mo/Ma cultured alone. (b) CD206 expression (average MFI±S.E.M.) on Mo/Ma co-cultured with TIS-T cells or control T cells relative to Mo/Ma cultured alone. (c) Percentage±S.E.M. of phagocytosing CD14+ cells. *P<0.05, **P<0.01, ***P<0.001, ns, not significant (P>0.05); statistical analysis were performed by using one way ANOVA test (n=4). Histograms represent (d) NO and (e) ROS production by Mo/Ma co-cultured with CD4+ (upper graphs) or CD8+ (lower graphs) T cells. Percentages±S.E.M. (n=4) of NO- and ROS-producing CD14+ cells are indicated in the histograms. (NO: P=0.011, CD4+ TIS-T/Mo-Ma versus CD4+ control T/Mo-Ma and P=0.014 CD8+ TIS-T/Mo-Ma versus CD8+ control T/Mo-Ma. ROS: p=0.041 CD4+ TIS-T/Mo-Ma versus CD4+ control T/Mo-Ma and p=0.006 CD8+ TIS-T/Mo versus CD8+ control T/Mo-Ma). Bar graphs represent MFI of NO and ROS-CD14+ producing cells relative to Mo/Ma cultured alone. *P<0.05, **P<0.01, ns, not significant (P>0.05); statistical analysis were performed using one-way ANOVA test (n=4)

