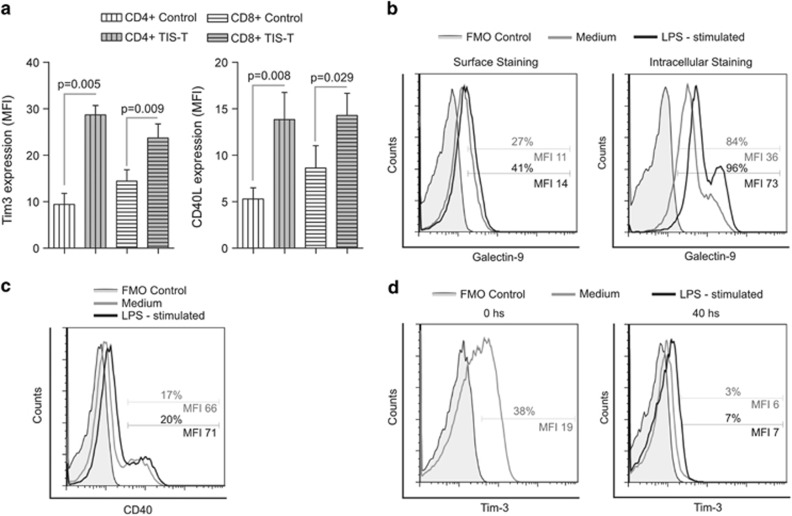
Figure 5.
Phenotypic profiling of CD4+ and CD8+ TIS-T cells and monocytes/macrophages. (a) Tim-3 and CD40L expression on stimulated control T cells and TIS-T cells. Bars represent Tim-3 or CD40L expression (MFI±S.E.M.) (n=6). Statistical analyses were performed using one-tailed paired t-test. P-values (TIS-T cells versus control T cells) are indicated on graph. (b–d) Monocytes were culture 40 h and then were either unstimulated or LPS-stimulated for 18 hours. (b) Representative histograms of Gal-9 expression on surface and intracellulary on LPS-stimulated or non-stimulated monocytes. (c) Representative histogram of CD40 expression on LPS-stimulated or non-stimulated monocytes. (d) Representative histograms of Tim-3 expression on recently isolated human monocytes (0 h, before culture) and on LPS-stimulated or non-stimulated monocytes. In all cases, fill histograms represent FMO control. Representative histograms are shown from one donor out of at least three different donors

