Figure 5.
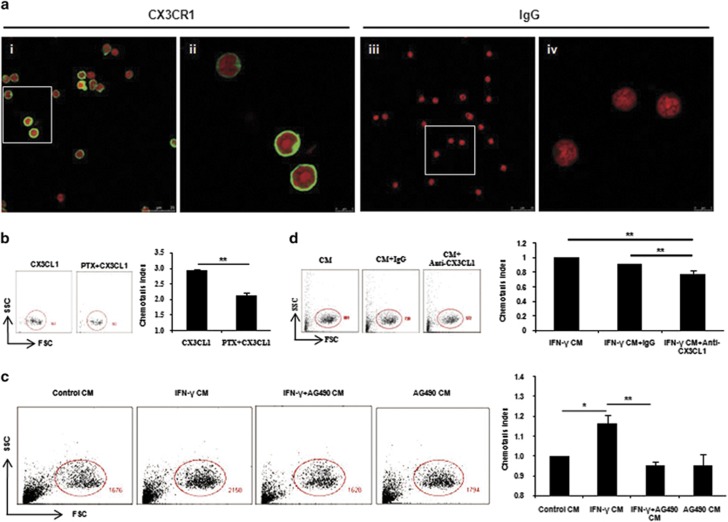
CX3CL1 facilitated peripheral NK cell migration. (a) Isolated splenic CD3−CD49b+ NK cells were spun onto slides, stained for CX3CR1 (green) or isotype IgG and counterstained with PI (red). Panels ii and vi show higher magnifications of the areas marked by the white rectangles in panels i and iii, respectively. Original magnification, × 63/1.40 (oil), zoom 1.00 (i and iii) and zoom 4.00 (ii and vi). Data shown are representative of two independent experiments from two mice. (b) To distinguish between chemotaxis and chemokinesis, NK cells were preincubated overnight with or without 500 ng/ml PTX before measuring cell migration. NK cells were gated on the basis of forward scatter and side scatter (FSC-SSC) and the numbers of NK cells were shown. Data show the mean±S.E.M. of three independent experiments. **P<0.01 by independent samples T-test. (c) After 12 h in culture, stromal cell CM (termed control CM), IFN-γ-treated stromal cell CM (termed IFN-γ CM), AG490-preincubated stromal cells before IFN-γ treatment CM (termed IFN-γ+AG490 CM) and AG490-treated stromal cell CM (termed AG490 CM) were collected and NK cell migration in response to them was measured as described above. For comparison, the chemotaxis index of NK cells toward control CM was set at 1. Data show the mean±S.E.M. of three independent experiments. *P<0.05 and **P<0.01 by one-way analysis of variance (ANOVA). (d) Five μg/ml anti-CX3CL1-neutralizing mAb or control rat IgG was added to the NK cell suspension and the migration of NK cells toward IFN-γ CM was measured as described above. The chemotaxis index of NK cells without any treatment toward IFN-γ CM was set at 1. Data show the mean±S.E.M. of three independent experiments. **P<0.01 by one-way ANOVA

