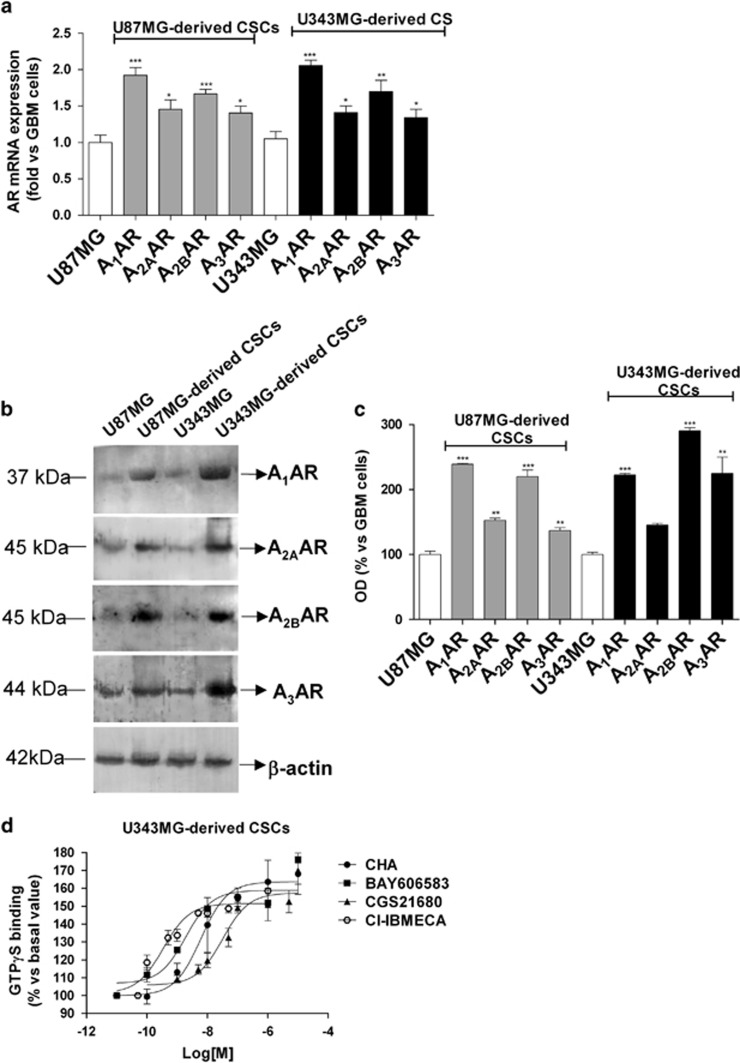
Figure 1.
Expression of ARs in CSCs derived from U87MG and U343MG cells. (a) The total RNA was extracted from whole U87MG cells and U343MG cells and from the respectively derived CSCs. The relative quantification of the AR subtype mRNAs was performed using real-time RT-PCR, as described in the Materials and methods section. The data were expressed as the fold change relative to the level of expression of each AR subtype in GBM cells (each set to 1) and they are the mean values±S.E.M. of three different experiments. (b and c) Cell lysates were prepared from whole U87MG cells, U343MG cells and the CSCs derived from them. The AR protein levels were evaluated using western blot analysis, using β-actin as the loading control. (b) Representative western blots. (c) Densitometric analysis of the immunoreactive bands performed using the ImageJ program. The data were expressed as the percentage relative to the level of expression in whole GBM cells, and they are the mean values±S.E.M. of three different experiments. The significance of the differences was evaluated using a one-way ANOVA with the Bonferroni post-test: *P<0.05, **P<0.01, ***P<0.001 versus the levels of expression in whole GBM cells. (d) [35S]GTPγS binding of U343MG-derived CSCs. Membrane aliquots (30 μg) obtained from CSCs were incubated with the indicated selective AR agonists at various concentrations. All of the data were expressed as the percentages of the level of basal [35S]GTPγS binding (set to 100%), and they are the mean values±S.E.M. of three different experiments, each performed in duplicate

