Figure 3.
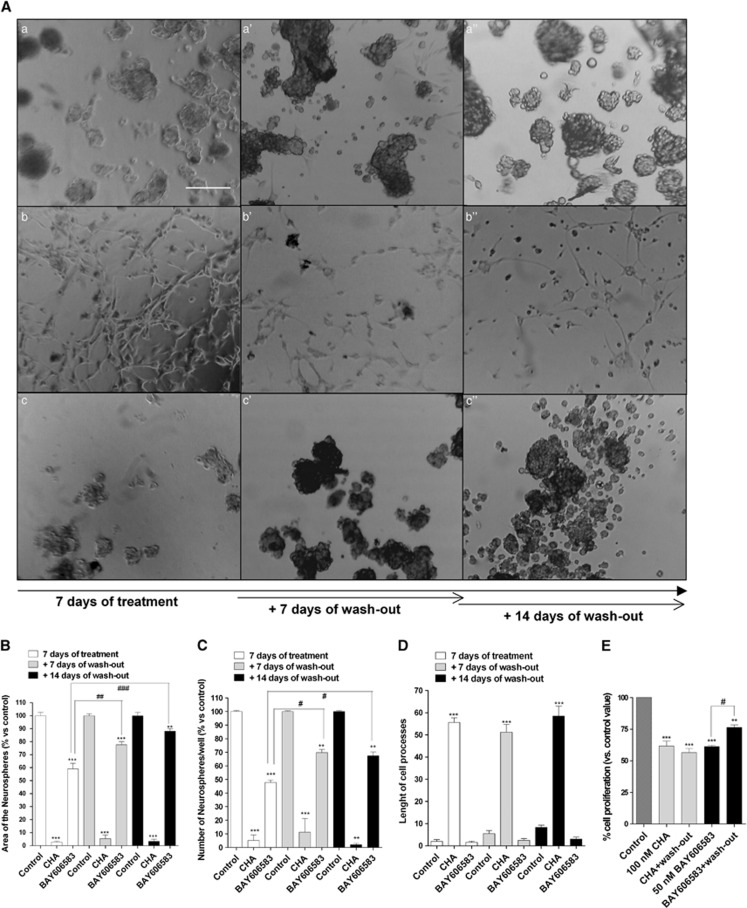
Effect of A1AR and A2BAR agonists on the sphere-derived cell morphology of the CSC-derived cellular spheres. CSCs were treated for 7 days with complete NSC medium containing DMSO (control, a), 100 nM CHA (b) or 50 nM BAY606583 (c). At the end of treatment periods, the drug-containing media were replaced with fresh drug-free NSC medium, and cells were cultured for another 7 (a', b', c') or 14 days (a”, b”, c”). (A) Representative micrographs taken after 7 days of treatment and after 7 or 14 days of drug wash-out are shown. The area of the culture plates occupied by the spheres (B), the number of spheres (C) and the length of the cellular processes (D) were scored after 7 days of treatment and after 7 and 14 days of drug wash-out. The counts represent the mean values±S.E.M. of three independent experiments. (E) CSCs were treated as in A, and cell proliferation was evaluated using the MTS assay. The data were expressed as percentages relative to that of the untreated cells (control), which was set at 100%, and they are the mean values±S.E.M. of three independent experiments, each performed in duplicate. The significance of the differences was determined using a one-way ANOVA with the Bonferroni post-test: **P<0.01, ***P<0.001 versus control; #P<0.05, ##P<0.01, ###P<0.001 versus cells treated for seven days

