Figure 4.
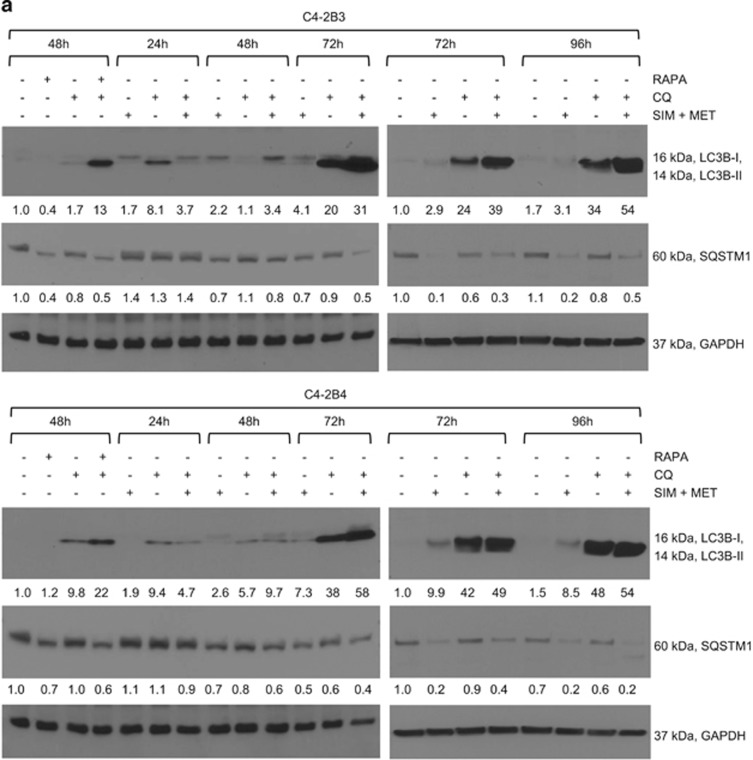
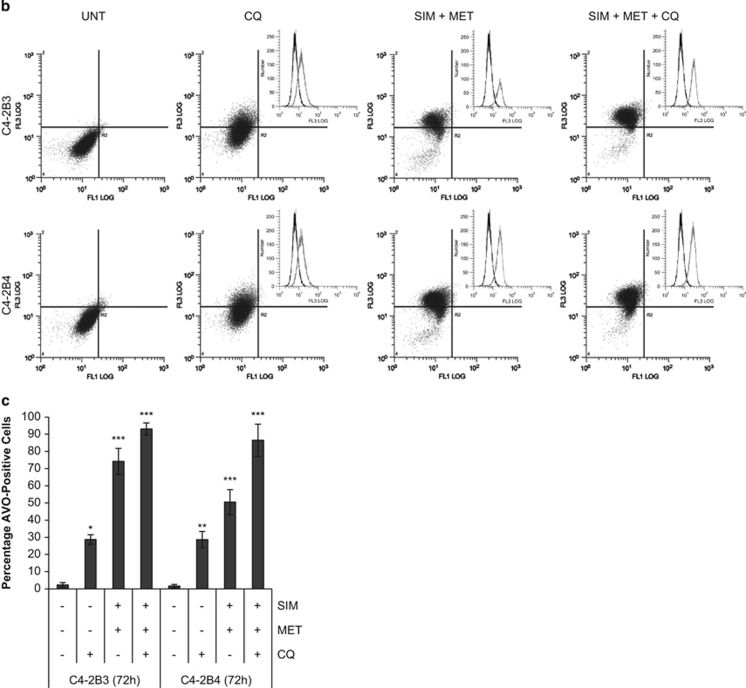
Combination simvastatin and metformin treatment increases autophagic flux in C4-2B metastatic CRPC cells. (a) Western blot analysis of LC3B-I and -II and sequestosome 1 (SQSTM1) protein expression in total cell lysates of C4-2B3 and C4-2B4 cells following treatment with combination 4 μM simvastatin (SIM) and 2 mM metformin (MET) and/or 10 μM chloroquine (CQ) lysosomal inhibitor for 24−96 h. Total cell lysates of C4-2B3 and C4-2B4 cells treated with 500nM rapamycin (RAPA) and/or 10 μM CQ used as autophagic flux positive controls. GAPDH used as loading control. (b) Representative density plots of acidic vesicular organelles (AVOs) by acridine orange staining using flow cytometry in C4-2B3 and C4-2B4 cells treated with combination 4 μM SIM and 2 mM MET±10 μM CQ for 72 h. In acridine orange-stained cells, the nucleus fluoresces green (FL1, 525 nm emission, x-axis), whereas acidic compartments fluoresce red (FL3, 620 nm emission, y-axis). The intensity of red fluorescence is proportional to the degree of acidity and to the volume of AVOs, including autophagic vacuoles. Insets show increase in red fluorescence (FL3, x-axis) with treatment compared with untreated control. (c) Quantification (mean±S.D.) of percentages of cells from each treatment group from b with a significant proportion of AVOs, n=3 separate experiments. *P<0.05, **P<0.01, ***P<0.001 determined by a two-tailed Student's t-test compared with untreated control. Representative density plots and quantification of positive controls shown in Supplementary Figure S4


