Figure 5.
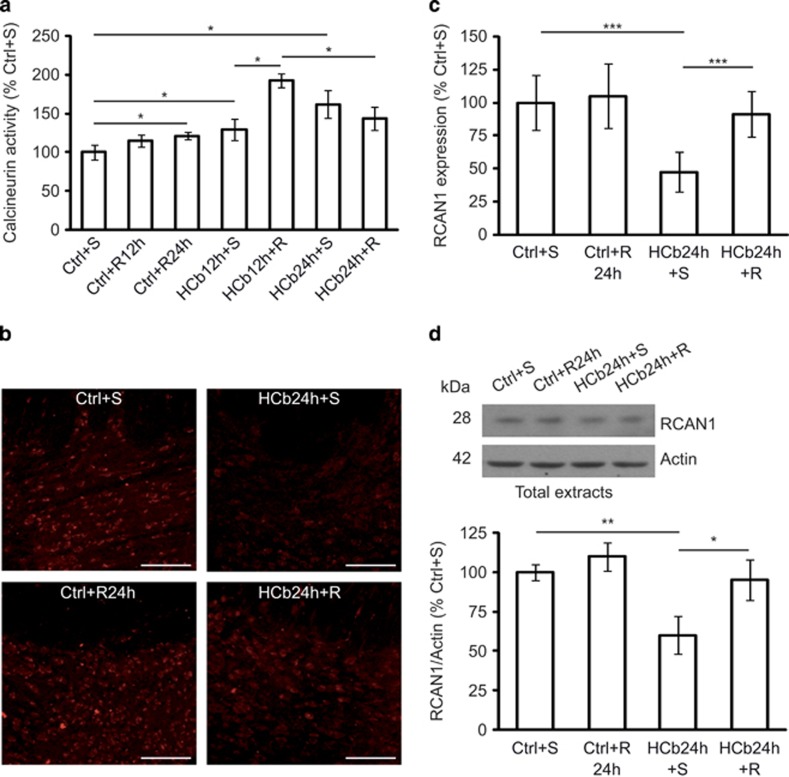
Rapamycin treatment stimulates calcineurin activity. (a) Histogram of calcineurin activity obtained by monitoring 32P release from radiolabeled purified RII substrate in axotomized precerebellar nuclei of saline- and rapamycin-treated Ctrl (Ctrl+S, Ctrl+R12h, and Ctrl+R24h) and saline- and rapamycin-treated HCb (HCb12h+S, HCb12h+R, HCb24h+S, and HCb24h+R) mice at 12 and 24 h. Data are expressed as mean (Ctrl+S percentage)±S.D. (*P<0.05, n=5). (b) Confocal images of RCAN1 staining of precerebellar nuclei of Ctrl+S, Ctrl+R, HCb+S, and HCb+R mice at 24 h. (c) Densitometric graph of RCAN1 staining in Ctrl+S, Ctrl+R24h, HCb24h+S, and HCb24h+R mice. Data are expressed as mean±S.D. (***P<0.001, n=6 mice per group, N=180 cells per group). (d) Representative immunoblots and densitometric graph of RCAN1 levels (Ctrl+S percentage) in precerebellar nuclei of Ctrl+S, Ctrl+R24h, HCb24h+S, and HCb24h+R mice at 24 h. Actin was used as loading control. Data are expressed as mean ±S.D. (*P<0.05, **P<0.01, n=5)

