Figure 3.
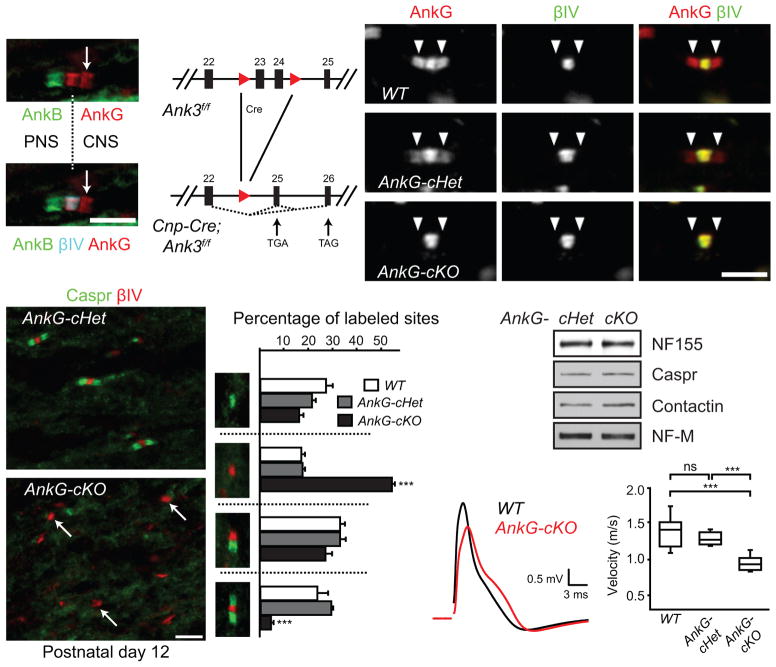
Paranodal junction assembly is disrupted in AnkG-cKO mice. (a) The dorsal root entry zone from a P7 mouse spinal cord immunostained for AnkB (N105/13), AnkG (N106/36) and βIV spectrin. The dotted line indicates the transition from PNS to CNS. The arrow points to the CNS paranode. (b) The scheme of the Ank3 conditional allele. The two loxP sites (red triangles) flank exons 23 and 24. After Cre recombination, a premature stop codon is generated in exon 25 or 26. (c–e) Immunostaining of P22 optic nerves (AnkG, N106/65). Arrowheads point to paranodes. (f, g) Immunostaining of P12 optic nerves. Arrows point to three nodal clusters without accompanying paranodal junctions. (h) Percentages of full nodes and nodal intermediates in P12 optic nerves (N = 3 for all genotypes). Unpaired two-tailed t tests (cKO vs. cHet): nodes alone: p = 0.000003; full nodes: p = 0.00001. The bar graphs show mean + SEM. ***, p < 0.001. (i) Immunoblots of P12 optic nerve homogenates. The full blots are presented in Supplementary Fig. 4. (j, k) Conduction of P17 optic nerves was measured using suction electrodes. N = 8 for WT and AnkG-cKO; N = 6 for AnkG-cHet. Two-tailed Mann-Whitney tests: WT vs. cHet: p = 0.282; WT vs. cKO: p = 0.0003; cHet vs. cKO: p = 0.0007. Data are shown in box-and-whisker plots (maximum, 75th percentile, median, 25th percentile, and minimum are shown). ***, p < 0.001; ns, not significant. Scale bars = 5 μm (a; f, g); 3 μm (c–e).

