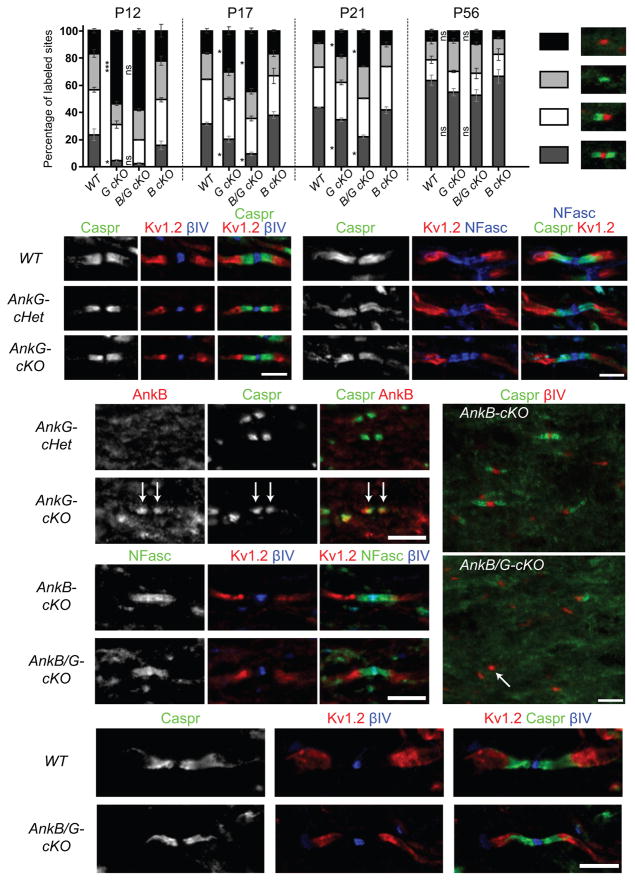
Figure 4.
Paranodal junctions recover over time in the CNS of the AnkG-cKO and AnkB/G-cKO mice. (a) Percentages of full nodes and nodal intermediates in P12, P17, P21 and P56 optic nerves. WT, wild type. G cKO, AnkG-cKO. B cKO, AnkB-cKO. B/G cKO, AnkB/G-cKO. The data for P12 WT and G cKO are the same as those shown in Fig. 3h. N = 2 mice for AnkB/G-cKO at P12, AnkB-cKO at P17 and all the genotypes at P21; N = 3 mice for the others. 200–500 sites per animal at P12 and 600–1400 at P17–P56 were counted. Unpaired two-tailed t tests: ***, p < 0.001; *, p < 0.05; ns, not significant (for exact p values, please see the supplementary methods checklist). The bar graphs show mean ± SEM. (b–k) Immunostaining of optic nerves from P22 (b, d, e), 1-year-old (c, j, k), P12 (f, i) and P21 (g, h) mice with antibodies as indicated. The anti-AnkB N105/17 was used in (d, e). The arrows in (e) point to paranodal AnkB; the arrow in (i) points to one nodal cluster of βIV spectrin without accompanying paranodal junctions. At least two mice per genotype and more than 150 nodes of each mouse were examined. Scale bars = 3 μm (b; c), and 5 μm (d–e; f, i; g–h; j–k).

