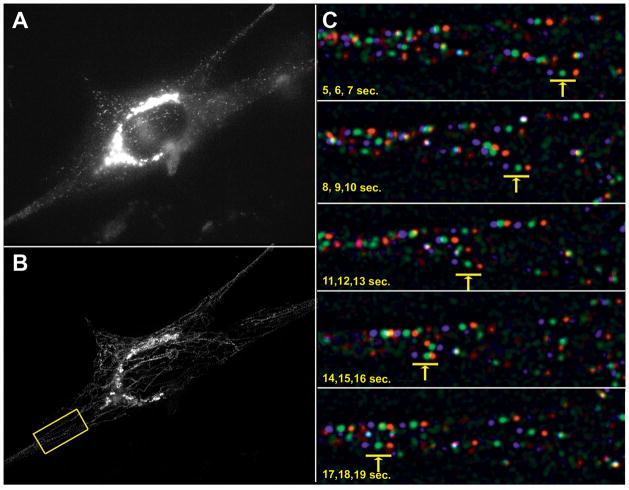
Figure 4. Rab6 exocytic vesicle velocity measurement in live SC4 cells.
A) A single frame from a time lapse SC4 cells transfected with plasmid expressing Rab6-mStrawberry, imaged at 1 second intervals for 1 minute. B) Total mobile vesicles depicted by subtracting the minimum pixel projection from the maximum pixel projection. C) Five frames of the time lapse from the region of interest in B, processed to facilitate tracking individual vesicles, are shown with successive frames in red, green and blue. The arrow and bar indicates the progress of an individual vesicle over a ten second time frame.

