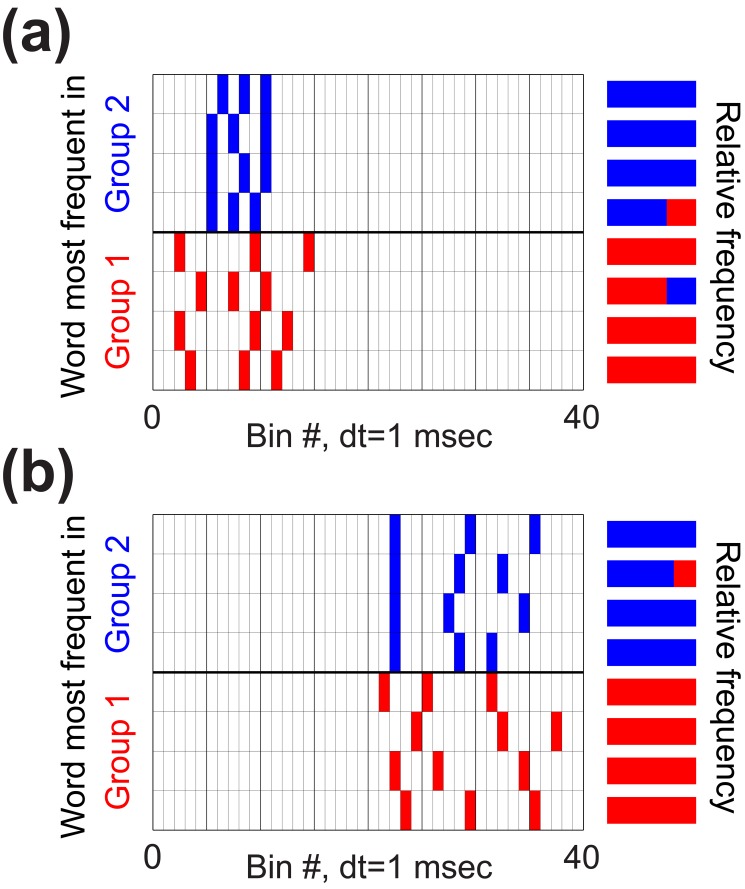
Figure 4. Spike patterns within bursts predict vocal acoustics.
Each grid shows eight “words” at time resolution dt = 1 ms (see Figure 3a). Here we consider words with equal numbers of spikes (three). Rows represent different words, columns represent characters within a word, and boxes are filled when a spike is present. Words are color-coded according to which behavioral group they appear in most frequently, with words appearing more often in groups 1 and 2 shown in red and blue, respectively. Colored bars at right show the relative frequency with which each word appears in group 1 or 2, for example a solid red bar indicates a word that only occurs in behavioral group 1. Data in (a) are from the same single-unit recording shown in Figure 1b, with behavioral groups determined by pitch (Figure 1c). Data in (b) are from a different single-unit recording with behavioral grouping in 3-D acoustic space. Note that although this figure illustrates subsets of observed words, mutual information is always computed over the full distribution of all words.

