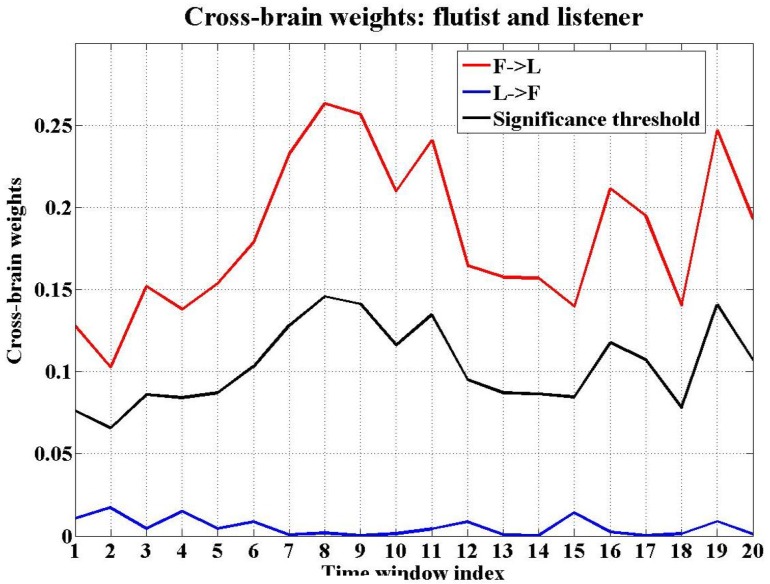
Figure 9. The cross-brain weights between flutist and listener in the second experiment.
This figure plots the cross-brain causalities between flutist and listener against time windows for piece A: Ibert, strict mode. The red curve indicates flutist listener, the blue curve represents listener
 flutist, while the black curve is the significance threshold.

