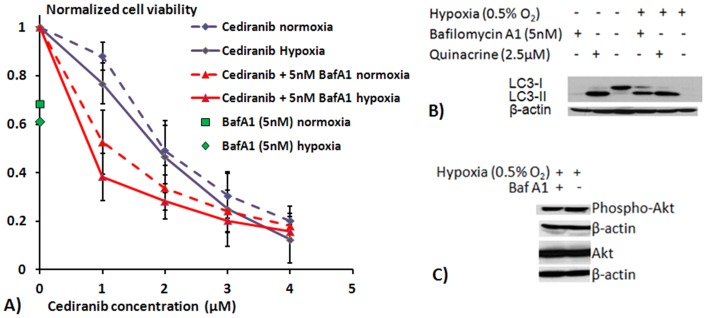
Figure 5. Bafilomycin A1/cediranib efficacy and bafilomycin A1 effects on LC3 and Akt.
A) Results from MTS cell viability assays showing mean 4C8 cell viability in response to treatment, normalized to untreated samples. Assays were performed after cells were exposed to cediranib and/or bafilomycin A1 treatment for 72 hours, under normoxic or hypoxic (0.5% O2) conditions. Results are mean ± SEM of three independent experiments, performed in triplicate. B) Representative LC3 western blots obtained from 4C8 cells grown under normoxic or hypoxic (0.5% O2) conditions for 10 hrs while untreated or exposed to quinacrine (0.8 µM) or bafilomycin A1 (5 nM). C) Representative basal Akt and phospho-Akt western blots obtained from 4C8 cells grown under hypoxic (0.5% O2) conditions for 24 hrs while untreated or exposed to bafilomycin A1 (5 nM).

