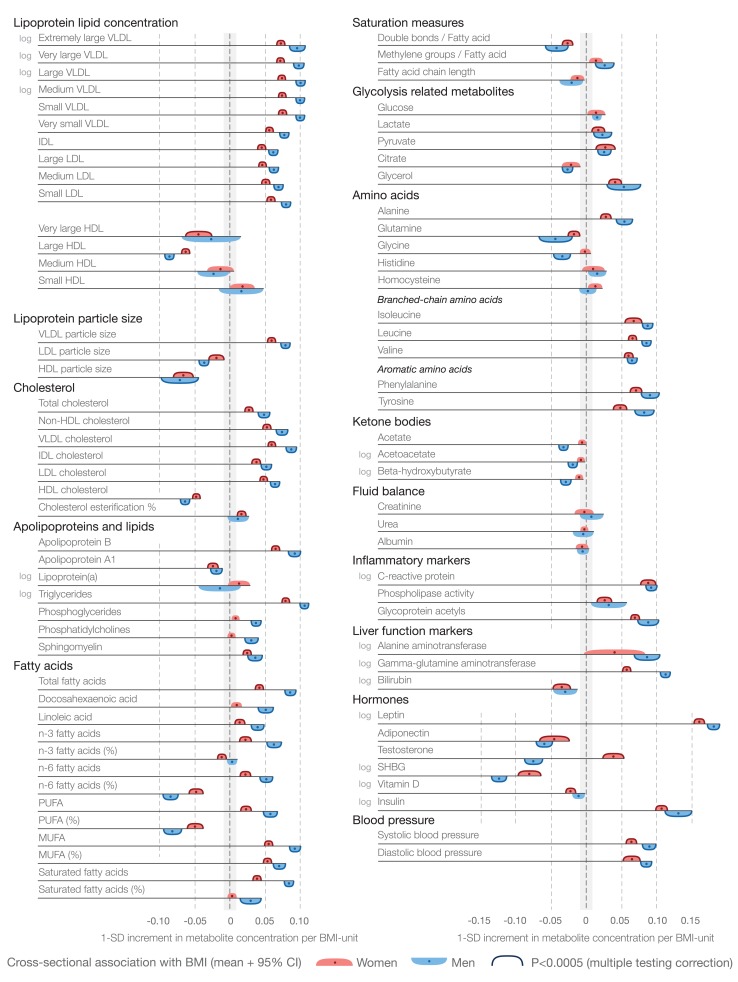
Figure 2. Cross-sectional associations of BMI with systemic metabolites for 6,468 women (red) and 6,196 men (blue).
Association magnitudes are indicated in units of 1-SD metabolite concentration per 1-kg/m2 increment in BMI. Associations were adjusted for age and meta-analyzed for the four cohorts of adolescents and young adults. Colored dots indicate β-regression coefficients, colored shading denotes 95% confidence intervals, and boundaries on the shading indicate p<0.0005. The continuous shape of the associations and magnitudes in absolute concentration units are illustrated in Figure S2. MUFA, monounsaturated fatty acid; PUFA, polyunsaturated fatty acid; SHBG, sex hormone–binding globulin.

