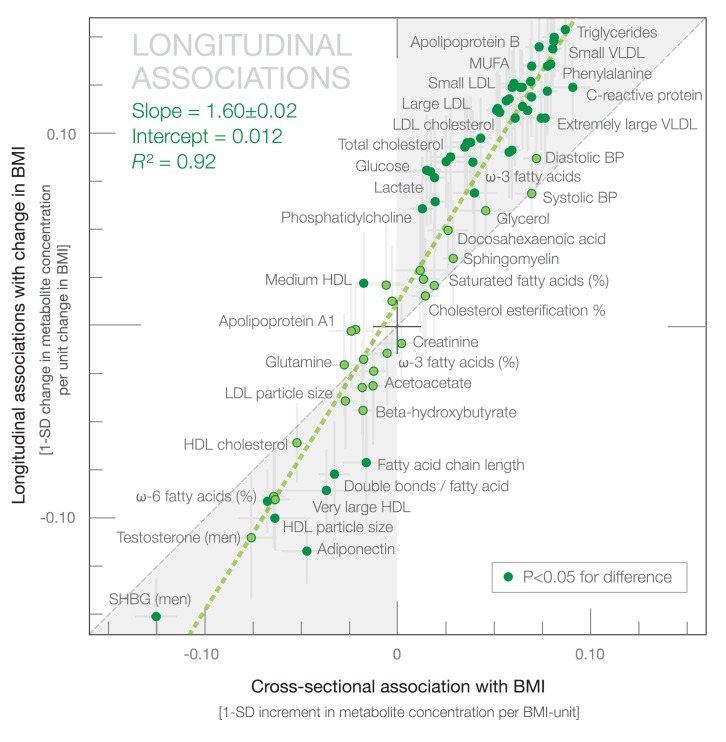
Figure 6. Correspondence between longitudinal associations of 6-y change in BMI with change in metabolites and cross-sectional associations.
The green dashed line denotes the linear fit between longitudinal and cross-sectional observations. Darker dots indicate statistical differences between longitudinal and cross-sectional association magnitudes. The gray shaded areas serve to guide the eye for the slope of correspondence. BP, blood pressure; MUFA, monounsaturated fatty acid; SHBG, sex hormone–binding globulin.

