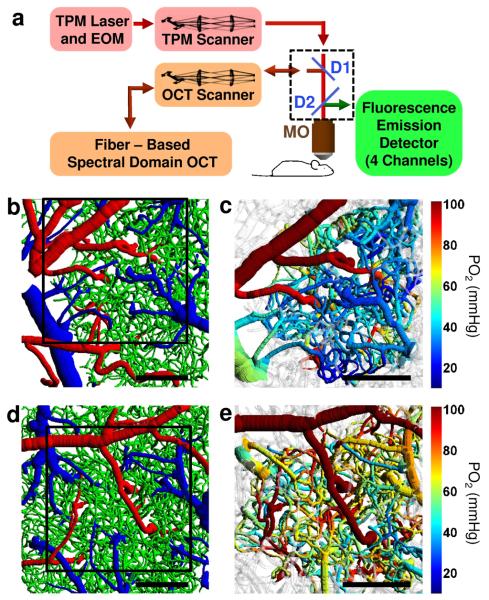
Figure 1. Imaging setup and representative images of the microvascular structures and oxygenation.
(a) Multi-modal microscopy setup. Two-Photon Microscope (TPM) and Spectral Domain OCT are coupled into the same microscope objective (MO). D1 and D2 – dichroic mirrors; EOM – electro-optic modulator; TPM and OCT scanners – galvanometer-mirror-based scanners together with the scan and tube lenses. (b, d) Top views of the two cortical microvascular stacks with the labeled microvascular segments: arterioles (red), capillaries (green), and venules (blue). (c, e) PO2 measurements during normocapnia (c) and hypercapnia (e) overlaid over microvascular structures presented in b and d, respectively. Black squares in b and d represent PO2 measurement fields of view presented in c and e, respectively. In gray-colored vessels PO2 was not estimated. Scale bars, 200 μm.

