
Figure 2. PO2 distribution measured inside the penetrating arterioles during normocapnia.
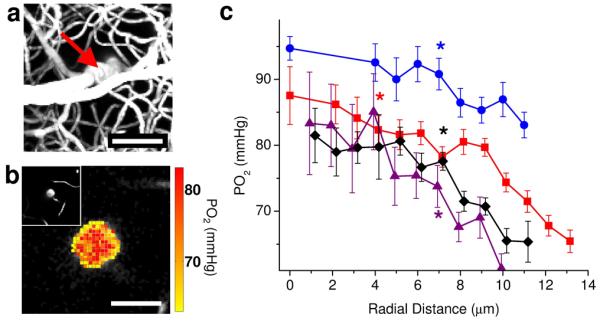
(a) Maximum intensity projection of the microvascular structure obtained by TPM showing diving arteriole at the center (red arrow). Scale bar, 50 μm. (b) PO2 map inside the penetrating arteriole in a, 100 μm below the cortical surface. Scale bar, 20 μm. Insert in the upper left hand side of the panel b shows a two-dimensional image from a microvascular stack (a) at the PO2 imaging depth (100 μm below the cortical surface). (c) Radial intra-arteriolar PO2 profiles (radial distance calculated from the vessel axis (vessel center) to the vessel wall) from 4 penetrating arterioles similar to the example vessel presented in a and b. For each PO2 profile, a star indicates the smallest radius where the mean PO2 is significantly lower than the PO2 at the vessel center (two-sample t-test; P <= 0.034). Data are expressed as mean ± s.e.m., calculated as detailed in the methods. Results are presented for n = 3 mice.