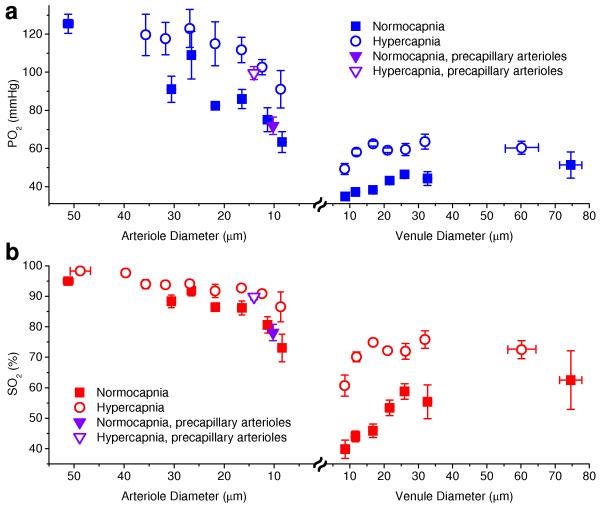
Figure 3. Oxygen content in arterioles and venules as a function of vessel diameter.
(a, b) Intravascular PO2 and SO2, respectively, as a function of arteriolar and venular diameters during normocapnia (solid symbols) and hypercapnia (empty symbols). Inverted triangle symbols represent mean values in precapillary arterioles. All mean PO2 and SO2 during hypercapnia experiments are statistically larger than mean PO2 and SO2 during normocapnia (Student t-test, P < 0.04, pairwise comparison for diameters < 25 μm and between combined measurements for diameters > 25 μm). Data are expressed as mean ± s.e.m. and were estimated averaging over all vessels over all animals. There were n = 3 mice for each group.

