
Figure 7. Correlation between SO2 and blood flow along the capillary paths.
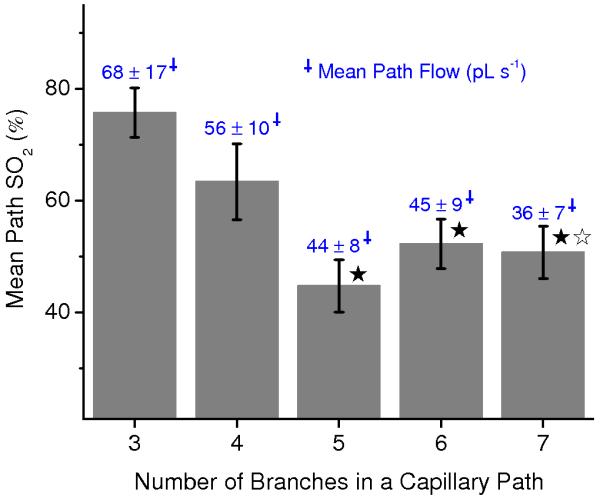
Dependence of the mean measured SO2 along the capillary path on a number of branches in a capillary path between precapillary arteriole and postcapillary venule. Simulated blood flow averaged along the same capillary paths is indicated above each bar (blue numbers). Star symbols indicate significant difference (Student’s t-test, P<0.05) when comparing to the results for 3 capillary branches (black asterisk – SO2; white asterisk – blood flow). Data are expressed as mean ± s.e.m. and were estimated averaging over all vessels over all animals. There were n = 3 mice.