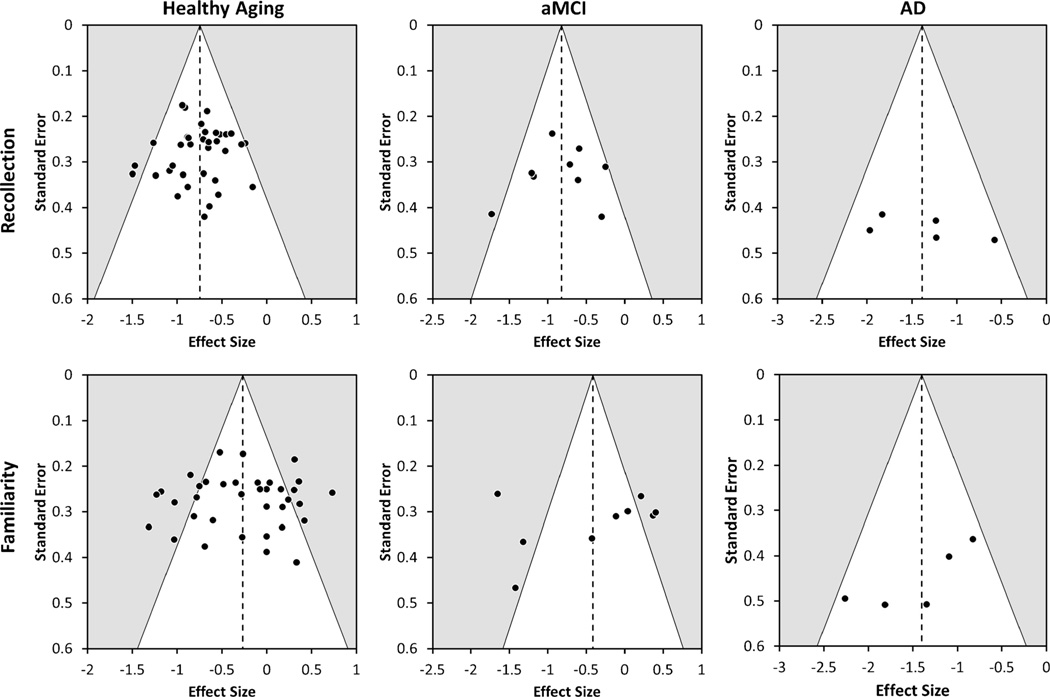
Fig. 1.
Funnel plots with the 95 % pseudo-confidence interval (white area) for recollection (top row) and familiarly (bottom row) differences in healthy aging, amnestic Mild Cognitive Impairment (aMCI), and Alzheimer’s disease (AD) studies. Note that the range of the effect sizes on the x-axis is differs across the plots.

