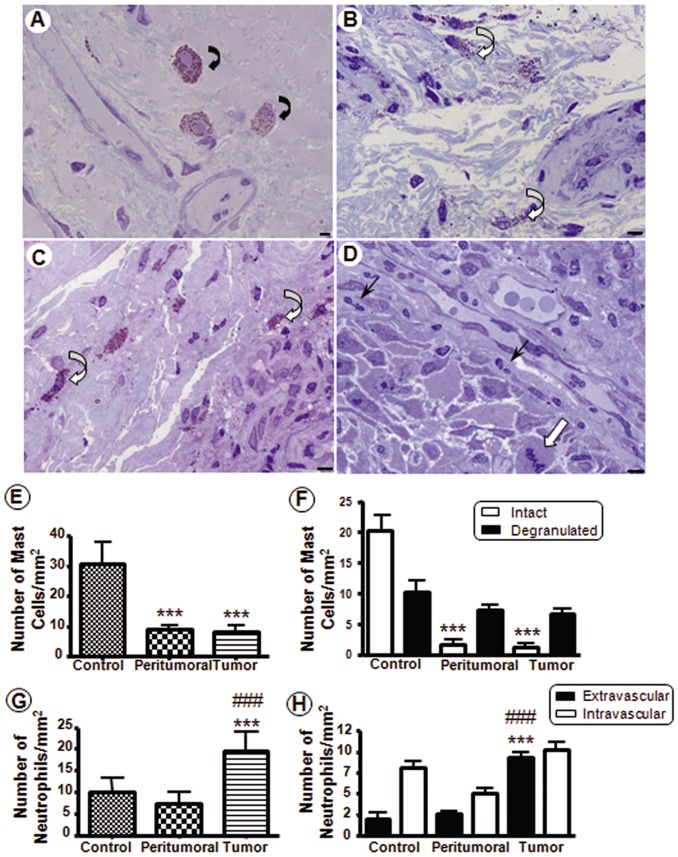
Figure 1. Influx of inflammatory cells in tumor samples from human laryngeal.
(A–D) Representative images (original magnification, ×63) of Toluidine Blue-stained tissue sections from laryngeal samples. (A) Control laryngeal sample showing intact mast cells (curve arrows) near the blood vessels. Peritumoral (B) and tumor (C) samples with degranulated mast cells (open curve arrows). (D) Tumor cells with mitotic activity (open arrow) and inflammatory cells, as extravascular neutrophils (arrows). (E) Total number of mast cells. (F) Intact and degranulated mast cells. (G) Total number of neutrophils. (H) Extra and intravascular neutrophils. Data are expressed as the mean ± SEM of the cell number per mm2 (n = 20 patients per group). One-way ANOVA followed by Bonferroni's test revealed a significant difference among the groups. *** P<0.001 vs. control, ### P<0.001 vs. peritumoral. Scale bars: 5 µm.

