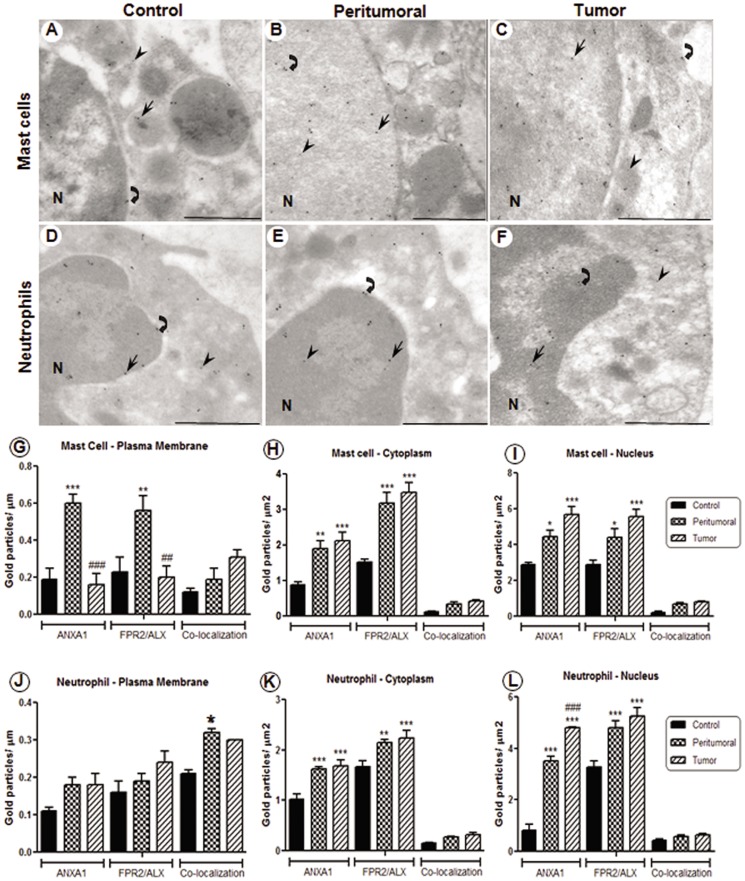
Figure 2. Immunoreactivity to ANXA1 and FPR2/ALX in mast cells and neutrophils of laryngeal sections.
Immunolabeling with 10-nm (FPR2/ALX) and 15-nm (ANXA1) colloidal gold particles. Mast cells (A–C) and neutrophils (D–F) showing subcellular localization of ANXA1 (arrows) and FPR2/ALX (arrowheads), and co-localization (curve arrows) in the plasma membrane, cytoplasm and nucleus (N) of control, peritumoral and tumor tissues. Density of gold particles conjugated with ANXA1 and FPR2/ALX in mast cells (G–I) and neutrophils (J–L). Data are expressed as the mean ± SEM of colloidal gold particles per µm in the plasma membrane and per µm2 in the cytoplasm and nucleus of cells (n = 10 cells per group). One-way ANOVA followed by Bonferroni's test revealed a significant difference among the groups. * P<0.05, ** P<0.01, *** P<0.001 vs. control, ## P<0.01, ### P<0.001 vs. peritumoral. Stained with uranyl acetate and lead citrate. Scale bars: 1 µm.

