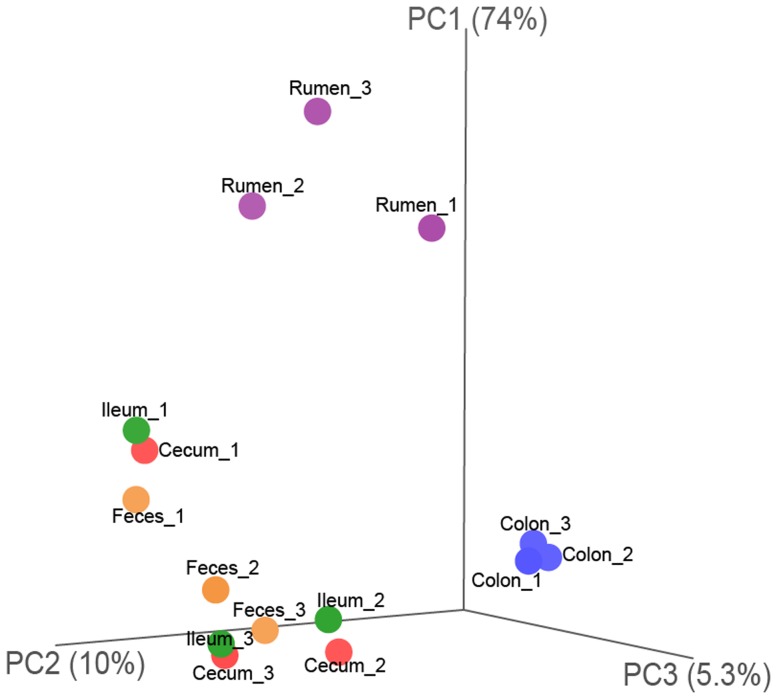
Figure 1. 16S rRNA gene surveys reveal hierarchical partitioning of all 15 samples.
Bacterial communities were clustered using principal coordinate analysis of the full-tree-based Unifrac matrix. Each point corresponds to a sample colored to indicate locations in the GIT. Three principal components (PC1, PC2, and PC3) explained 89.3% variation.

