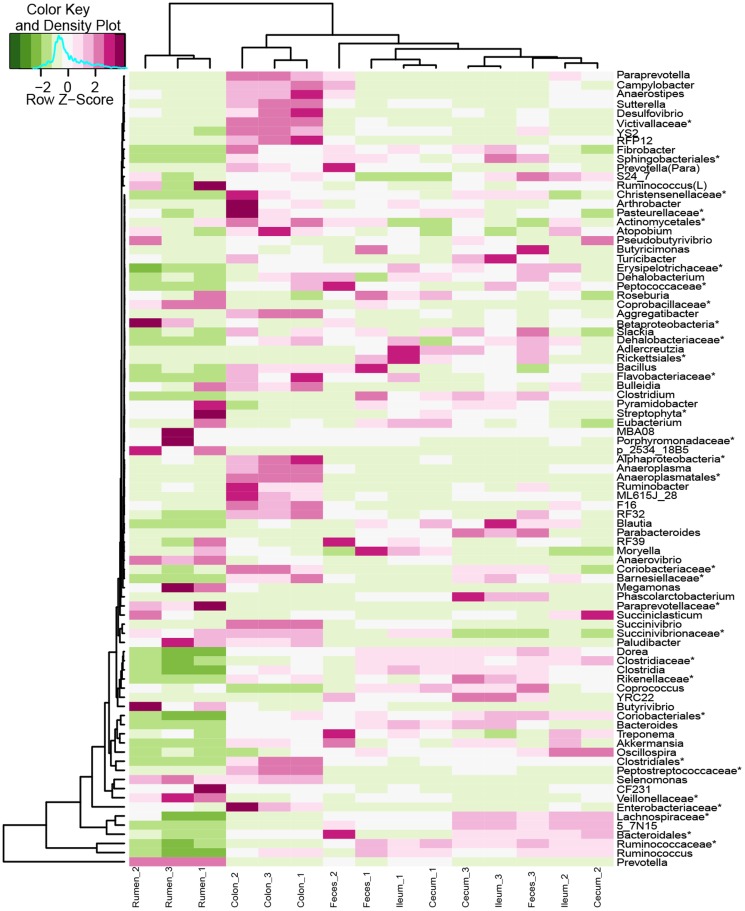
Figure 4. Heatmap analysis showing the distributions of bacterial communities at genus level in the GIT of three roe deer.
Individual cells are color-coded according to raw Z-scores to show the abundance of a particular genus in each region. The asterisk means the unclassified bacteria at the family, order, or class levels.

