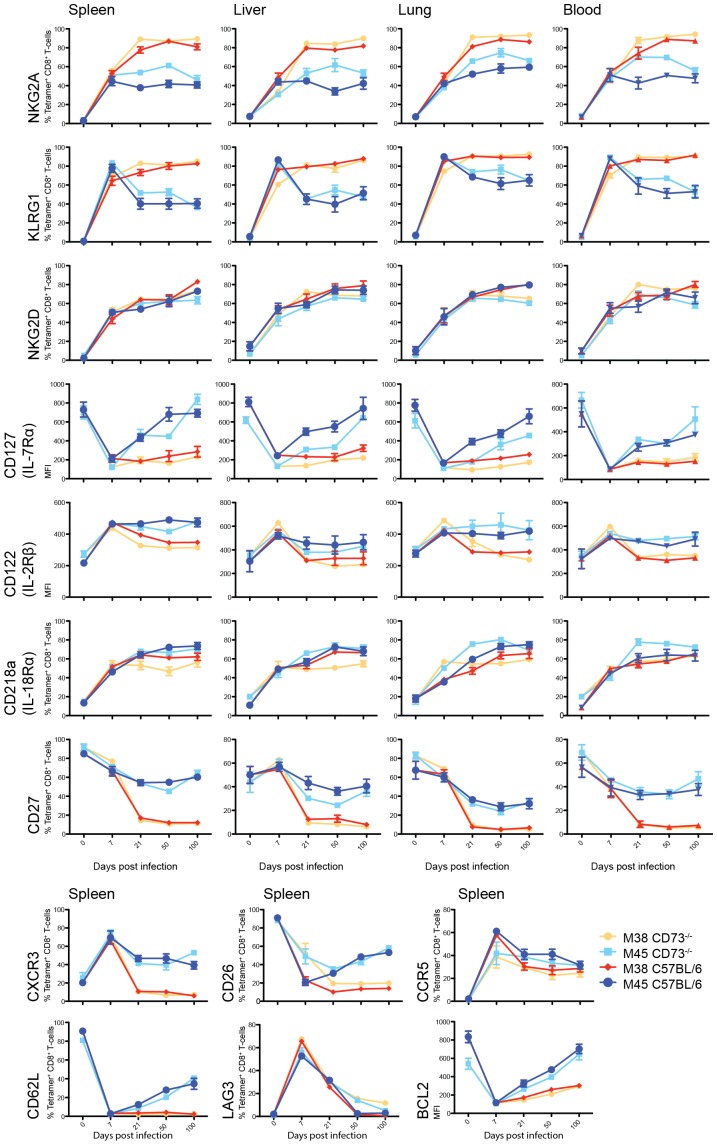
Figure 3. Phenotype of specific CD8+ T-cells in CD73−/− mice after MCMV infection.
Time course showing the percentage of cells expressing or MFI of the indicated markers on M38- (red/orange) and M45-specific CD8+ T-cells (blue/light blue), in the spleen, liver, lung and blood in comparison with naive CD8+ T-cells (n = 6, mean±SEM).

