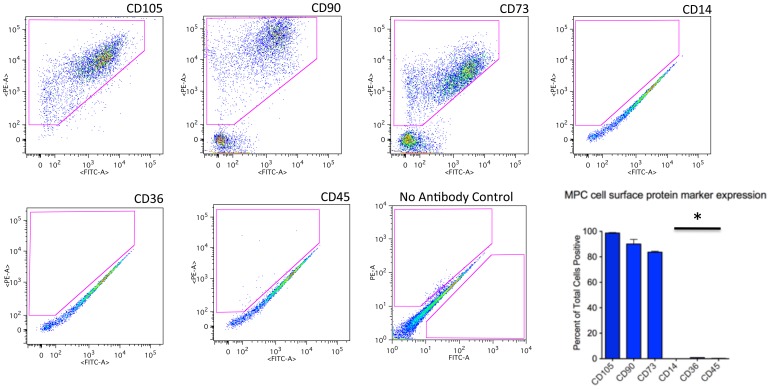
Figure 2. Flow cytometry analysis of cells isolated from traumatized muscle by 2-hour adherence to TCPS.
Cells were isolated and cultured after 2-hr adherence to TCPS (Figure 1B). The cells were then processed for flow cytometry using fluorescent-conjugated antibodies against the cell surface markers indicated in the figure. The gated regions, indicated by a red geometric figure within the plot, containositive cells. Also shown is a bar graph reflecting the number of positive cells for each marker (mean ± SEM, n = 8). Significant difference is noted (*) between the CD14, CD36, CD45 as compared to CD105, CD90, CD73 (Mann Whitney U Test, p≤0.01).

