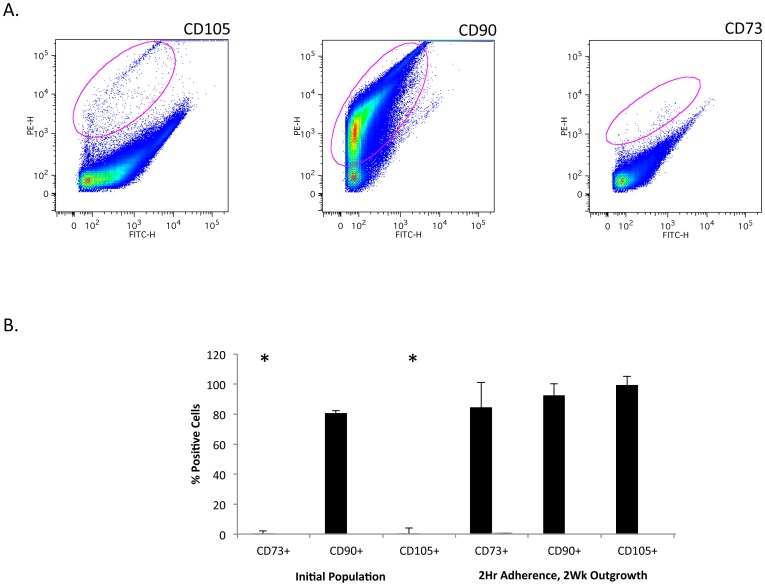
Figure 3. Analysis of CD105, CD90 and CD73 positive cells in a single cell suspension from traumatized muscle.
A. single cell suspension (Figure 1C) from collagenase digested traumatized muscle tissue was processed for flow cytometry using fluorescent-conjugated antibodies against the cell surface markers indicated in the figure. The gated regions, indicated by a red circle within the plot, contain the positive cells. B. For each marker the bar graph reflects the number of positive cells isolated (mean ± SEM, n = 12) as in Figure 1B (2 Hr Adherence, 2 Wk outgrowth) or as in Figure 1C (Initial Population). Significant difference is noted (*) between CD73 and CD105 in the initial population and the other conditions (Student's t-test, p≤0.01).

