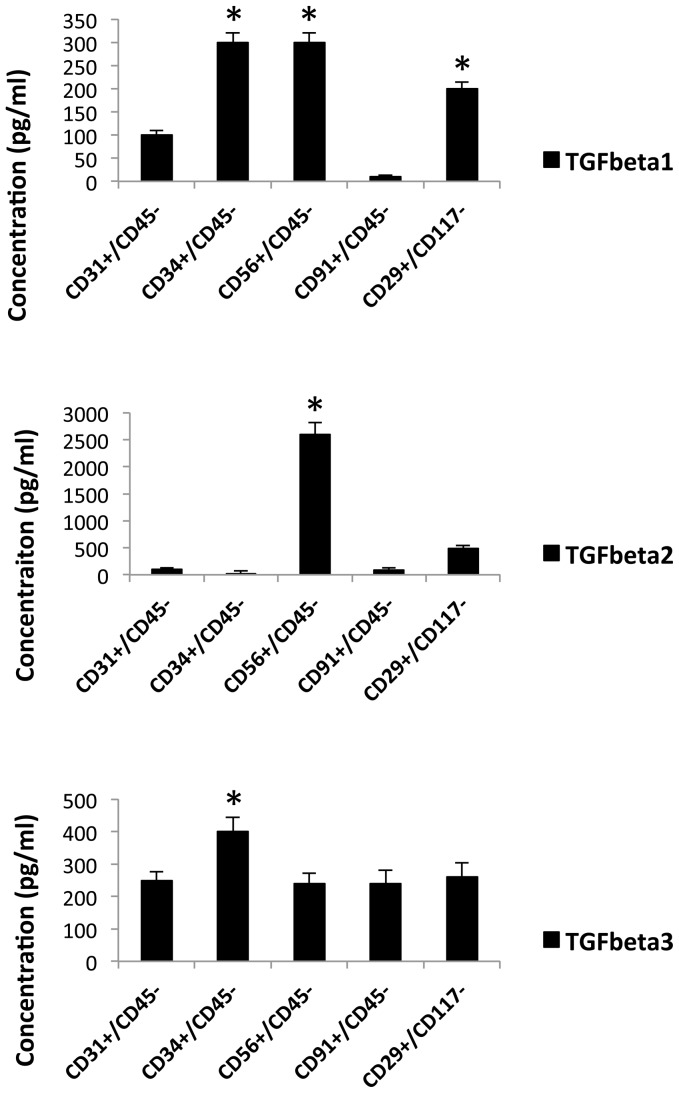
Figure 7. Inflammatory cytokine secretion of CD29, CD31, CD34, CD56 and CD91 positive cells.
Flourescent-conjugated antibodies to CD29, CD31, CD34, CD56 and CD91 were used to separately sort and subculture cells form collagenase 2 digested human muscle tissue. The cells were cultured to confluence and the supernatants were removed and assessed for TGFß1, TGFß2 and TGFß3 levels by ELISA. The graph indicates the concentrations of the cytokines (mean ± SEM, n = 8). A significant difference in amounts (mean pg/ml) is noted (*) between CD34, CD56 and CD29 for TGFß1, CD56 for TGFß2 and CD34 for TGFß3 when compared to the other populations (Mann-Whitney U Test, p≤0.01).

