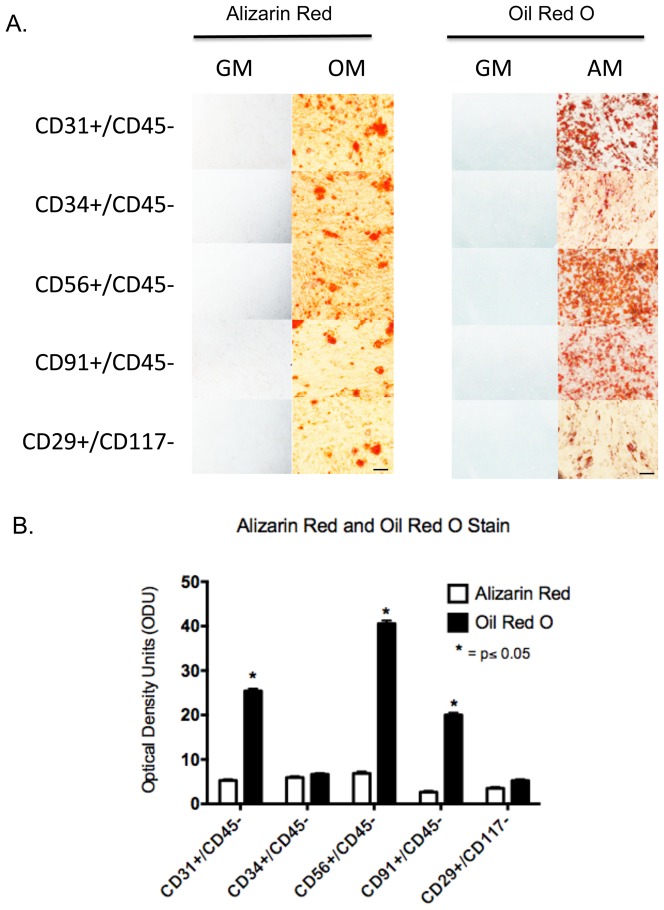
Figure 8. Osteogenesis and adipogenesis of CD29+, CD31+, CD34+, CD56+ and CD91+ cells.
A. Flourescent-conjugated antibodies to CD29, CD31, CD34, CD56 and CD91 were used to separately sort and subculture cells form collagenase 2 digested human muscle. The cells were cultured to confluence then the cells were cultured for an additional three weeks in either osteogenic media (OM), adipogenic media (AM) or regular growth media (GM). The cultures were fixed and processed for Alizarin Red or Oil Red O staining. Scale bar = 100 µm. B. For each marker the bar graph reflects the number of optical density units (ODU) (mean ± SEM, n = 5), as measured with Image J, for Alizarin and Oil Red O staining of isolated cell types differentiated in osteogenic media (OM) and adipogenic media (AM). Significant difference is observed (*) in Oil Red O staining between CD34 and CD29 compared to CD31, CD56, and CD91 (Student's t-test, p≤0.05).

