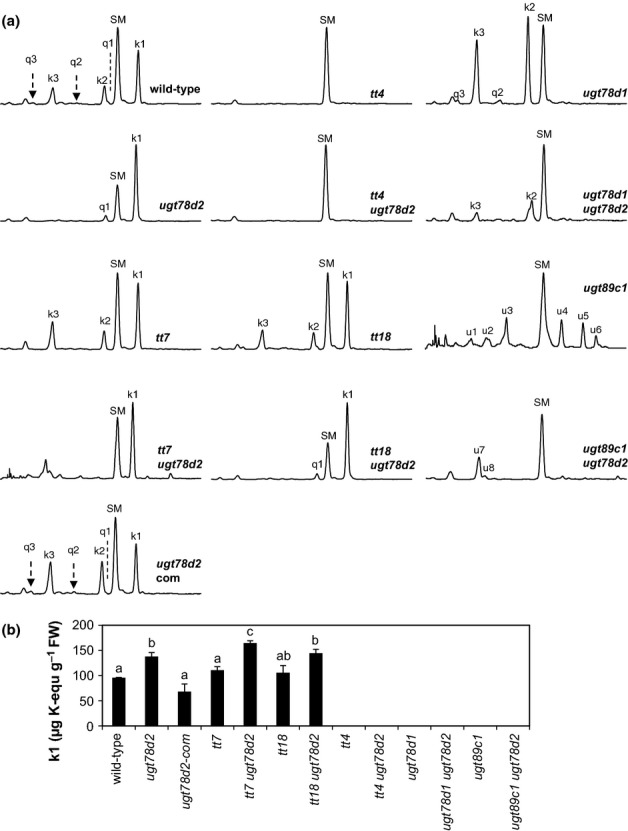
Figure 3.

Flavonol glycoside pattern in Arabidopsis thaliana mutants affecting flavonoid biosynthesis and conjugation. (a) Flavonols extracted from stems (lower region of 2.5 cm) of the wild-type and flavonoid metabolism-related mutants. The scale of all representative high-performance liquid chromatograms is identical. Peaks u1–u8 represent unknown flavonoids. SM, sinapoyl malate. (b) Quantification of k1 (Fig.1b) in the wild-type and flavonoid metabolism-related mutants. The means of k1 ± SD from four biological samples (a pool of three to five individual stem segments for one sample) are shown. k1 was quantified using kaempferol aglycone as a standard. Letters above the error bars represent a significant difference between genotypes by a paired t-test (P < 0.01).
