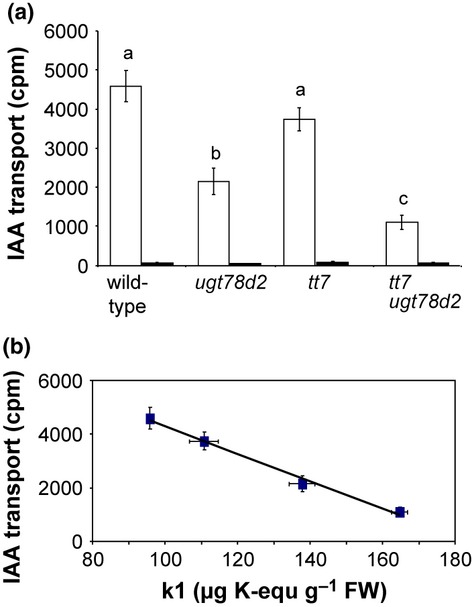
Figure 4.

Basipetal auxin transport in inflorescence stems. (a) Basipetal auxin transport in Arabidopsis thaliana wild-type, ugt78d2, tt7 and tt7 ugt78d2 basal stem segments. Data represent radioactivity accumulated in basal segments (means ± SE obtained from 10 individual plants without N-1-naphthylphthalamic acid (NPA) treatment and from two individual plants for NPA treatment)). Closed bars, +NPA; open bars, –NPA. Letters above the error bars represent a significant difference between genotypes by a paired t-test (P < 0.05). (b) Basipetal auxin transport in relation to k1 levels. Mean value and standard error are plotted. A linear relationship was observed (R2 = 0.9911).
