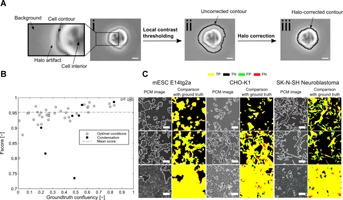
Figure 1.

Method for the segmentation of phase contrast microscopy (PCM) images. (A) (i) Cropped region of a mouse embryonic stem cell PCM image shortly after seeding. Insert shows a zoomed-in region with description of the key features of a typical PCM image including a halo artifact surrounding the cell and the lack of contrast between the background and the interior of the cell (ii) Cell contour detected (black line) after local contrast thresholding. A large portion of the pixels corresponding to the halo artifact are incorrectly classified as cell pixels. (iii) Cell contour detected (black line) after post-segmentation halo correction. It conforms to the actual contour of the cell. Scale bars are 10 µm. (B) F-score as a function of the ground truth image confluency. Closed symbols represent images with degraded quality due to condensation. (C) Examples of segmentation outcomes for mouse embryonic stem cells (mESC), Chinese hamster ovary cells (CHO) and neuroblastoma cells. For each example, the raw PCM image overlaid with the detected border is compared with the ground truth image (to the right of the raw image). True positives are yellow, false positives green, true negatives black, and false negatives red. Scale bars are 50 µm.
