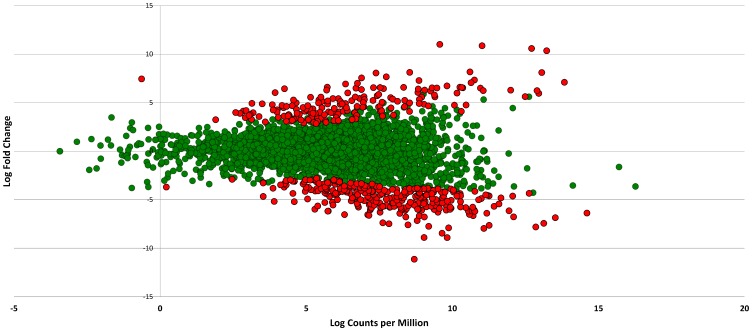
Figure 1. Smear plot of differentially expressed genes in V. vulnificus CMCP6 exposed to human serum (relative to artificial seawater).
The smear plot shows the relationship between the log fold change and log counts per million. Green points represent non-significant DE genes whereas red points show genes that are significantly differentially expressed (p<0.0001) in relation to artificial seawater.

